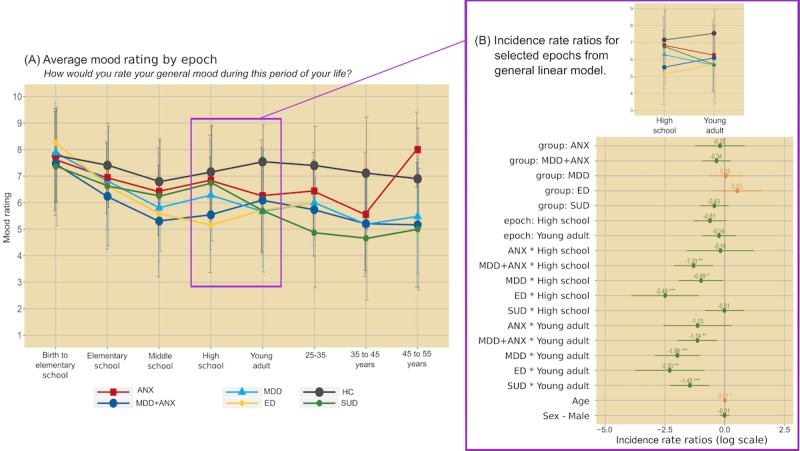
Figure 2.

Average mood rating by epoch (left panel) and regression coefficients from generalized linear mixed effects models (right panel). Error bars on the left graph represent standard deviation; error bars on the right graph represent 95% CIs; positive values in orange, negative values in green), with P value thresholds noted with *.05, **.01, and ***.001. ANX: anxiety disorder; ED: eating disorder; HC: healthy comparison; MDD: major depressive disorder; MDD+ANX: major depressive disorder comorbid with anxiety disorder; SUD: substance use disorder.
