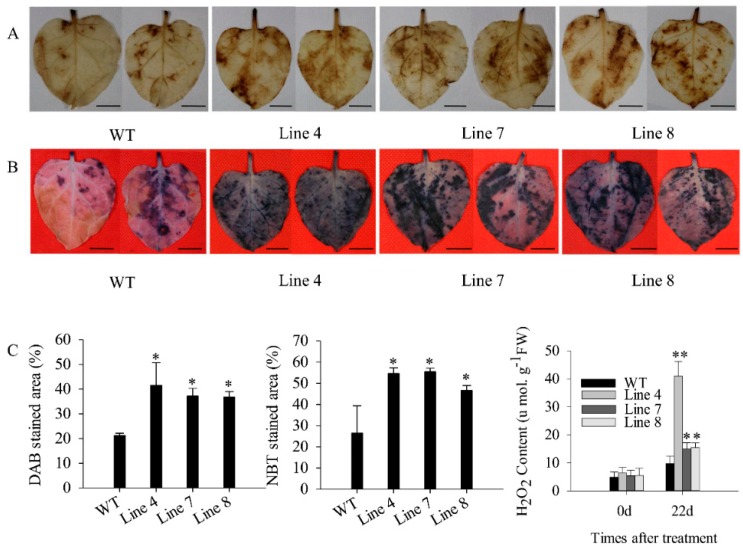
Figure 7.
DAB and NBT staining of transgenic and wild-type lines after 22 days of salt stress. (A) DAB staining of transgenic and wild-type lines after 22 days of treatment with 200 mM NaCl. (B) NBT staining of transgenic and wild-type lines after 22 days of treatment with 200 mM NaCl. (C) The DAB, NBT stained area (%) and H2O2 content of transgenic and wild-type lines after 22 days of treatment with 200 mM NaCl. The black line is used as a scale bar (length 0.75 cm). * and ** represent significant differences at p ≤ 0.05 and p ≤ 0.01 respectively. Mean values and SDs at least for three biological replicates are shown.

