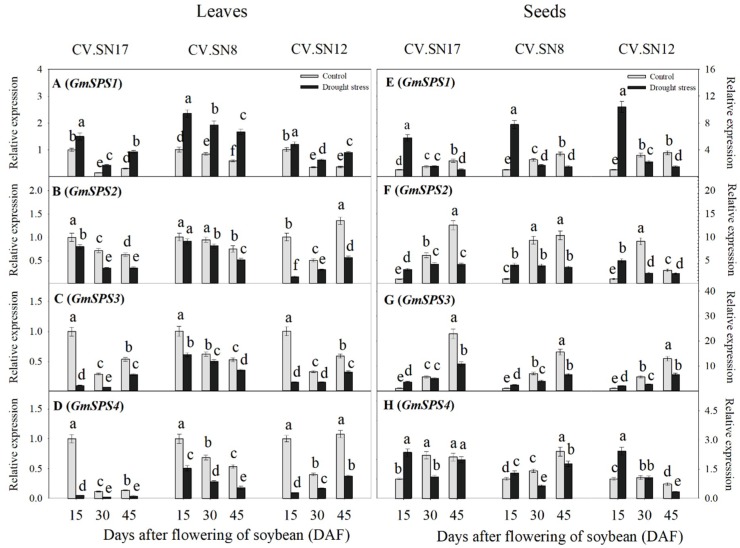
Figure 5.
Effect of drought stress on the expression levels of GmSPS genes in leaves and seeds: (A,E) GmSPS1; (B,F) GmSPS2; (C,G) GmSPS3; and (D,H) GmSPS4. Standard deviations were calculated with three independent experiments each comprising two soybean plants. Different letters above vertical bars indicate significant differences between means at a p < 0.05 level.

