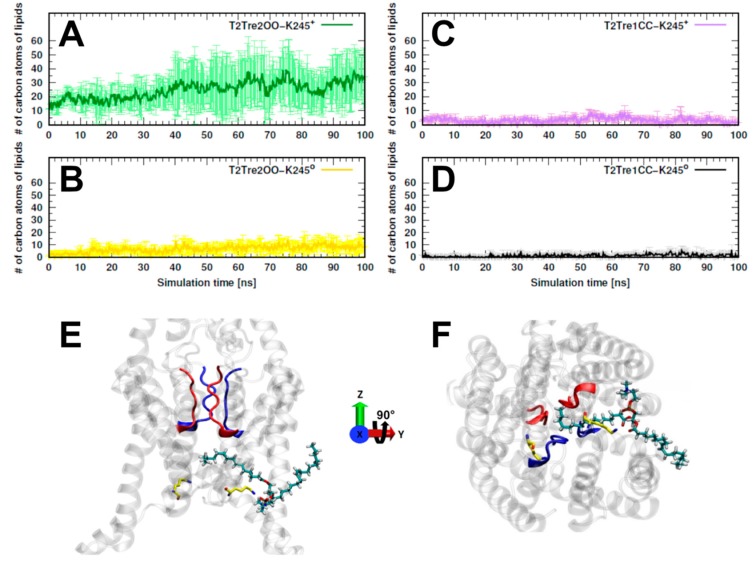
Figure 5.
Evaluation of the lipids protruding toward the fenestrations and the central cavity during the entire simulation time. The entrance of lipids in the conduction pore and fenestrations were measured as a function of the number of carbon atoms belonging to the lipids and protruding into these regions. (A,B) The average of carbon atom number in three replicas for T2Tre2OO-K245+ and T2Tre2OO-K2450, respectively. Correspondingly to (A,B), they are shown for T2Tre1CC-K245+ and T2Tre1CC-K2450 in (C,D). The figures (E,F) represent the frontal and intracellular views of a 1-palmitoyl-2-oleoyl-sn-glycero-3-phosphocholine (POPC) lipid molecule protruding through the side fenestration in the T2Tre2OO-K245+ simulation. K245 is shown in yellow.

