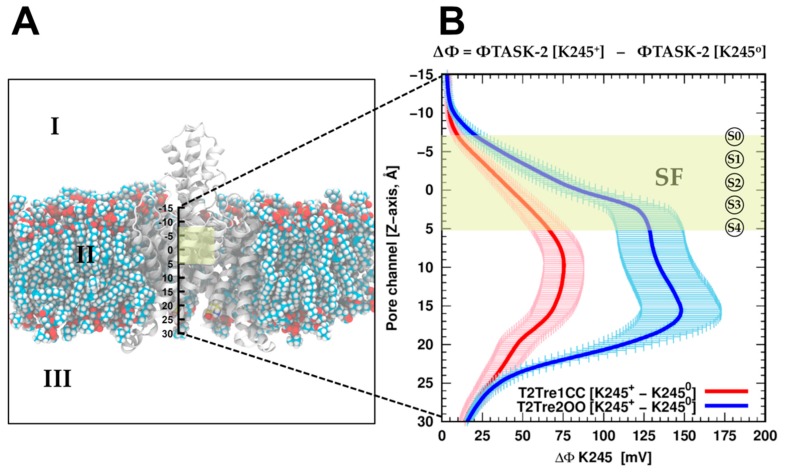
Figure 6.
Electrostatic potential difference (ΔΦ) of K245 in TASK-2 systems. The ΔΦ was computed for protonated TASK-2 systems by solving the Poisson–Boltzmann equation with APBS software through the last 50 ns of the trajectory. Both the TASK-2 channel and the lipid membrane exported from the MD simulations were used explicitly in the calculation. The dielectric constant was set at ε = 2 for zone II (protein and membrane) and ε = 80 for zone I and III, corresponding to an implicit solvent with an ionic concentration of 150 mM of KCl. The ΔΦ was measured along the Z-axis between the coordinates [−15, 30] Å represented in (A). This range in Z-axis corresponds to the extracellular region of the channel Z < −15 Å, and the end of the inner helices TM2 and TM4 in the intracellular space is represented by Z = 30 Å; (B) ΔΦ plot for TASK-2 based on TREK-1 and TREK-2 subsets representing the closed and open states of the fenestrations in red and blue colors, respectively. ΔΦ is the subtraction of the electrostatic potential (Φ) of the system with K245 protonated from the Φ of the system with K245 neutral at the Z-axis [−15, 30] Å. The selectivity filter region (shown in a yellow rectangle) comprises the coordinates from S0 at Z ≈ −7 Å until S4 at Z ≈ 5 Å. The site in the central cavity (Scav) is located at Z ≈ 10 Å approximately.

