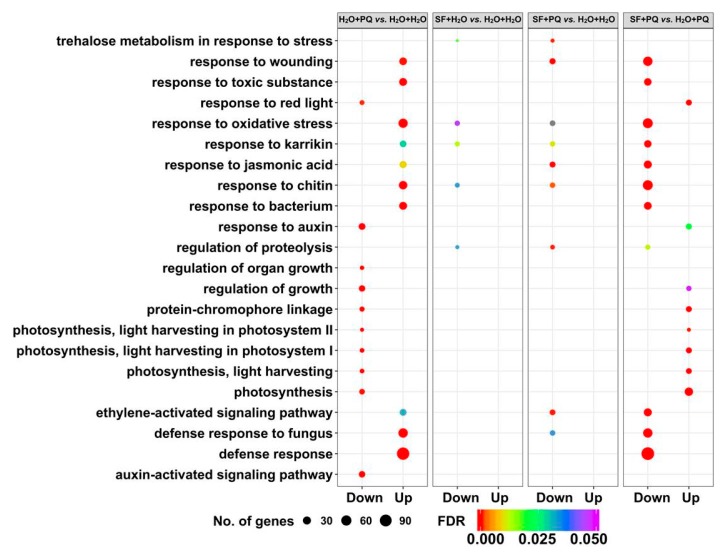
Figure 2.
Comparison of the top five enriched GO categories from all pairwise combinations. The top five (most significant) enriched biological process GO terms from all pairwise combinations are illustrated as a bubble plot. The size and color of the circle denotes the number of differentially expressed genes and FDR (false discovery rate) adjusted p-value, respectively. Unprimed and unstressed (H2O + H2O), PQ-stressed (H2O + PQ), SF-primed but unstressed (SF + H2O), and SF-primed and stressed (SF + PQ).

