Figure 3.
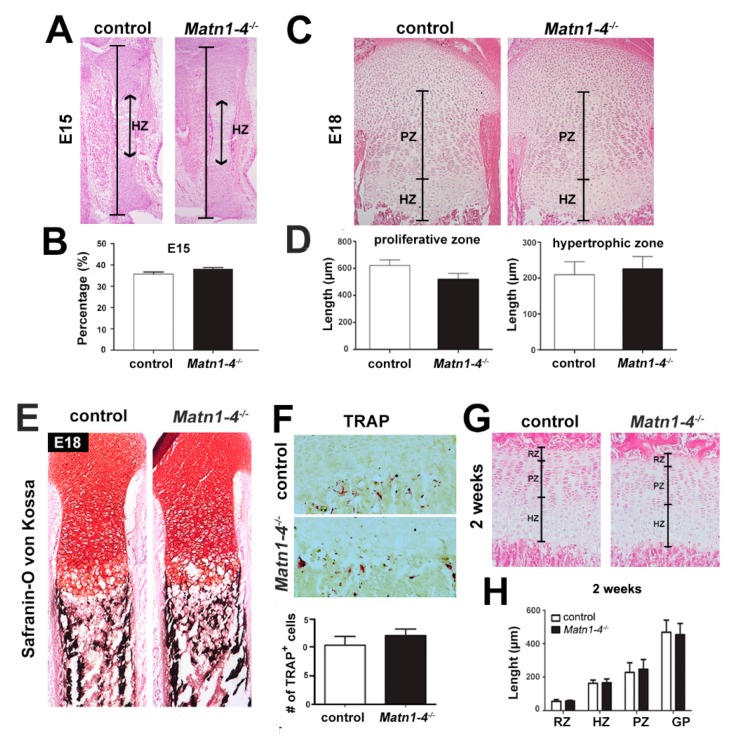
Normal cartilage development and growth plate structure in long bones of Matn1-4−/− mice. (A) HE-stained proximal tibiae at E15.5 show normal length, structure and hypertrophic zone (HZ) in Matn1-4−/− mice. (B) Percentage of the hypertrophic zone relative to the entire cartilaginous mass of the tibia was similar in Matn1-4−/− and in the control animals. (C) HE-stained proximal tibiae at E18 and morphometric measurements of the proliferative (PZ) and hypertrophic (HZ) zones (D) demonstrate normal structure of the growth plate in the Matn1-4−/− mice. Safranin O-von Kossa (E) and TRAP staining (F) show comparable mineralization and chondroclast/osteoclast activity at the chondro-osseous junction in control and Matn1-4−/− mice. Quantification of the TRAP positive cells in the tibial growth plate of control and Matn1-4−/− mice shows no difference at the chondro-osseous junction. (G) HE-staining of the tibial growth plate at 2 weeks and morphometric analysis (H) of the length of the entire growth plate (GP) and the separated growth plate zones (RZ-resting; PL-proliferative; HZ-hypertrophic) indicate normal columnar organization of the chondrocytes and normal GP zonality in Matn1-4−/− mice. Original magnifications: ×10 for (A), (C) and (E); ×20 for (F) and (G).

