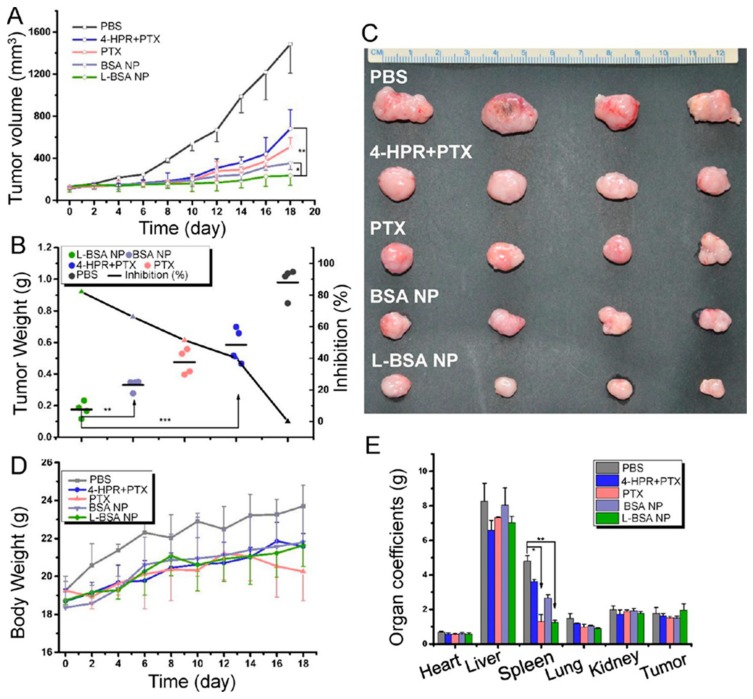
Figure 7.
Antiglioma efficacy on the subcutaneous glioma mouse model. (A) Tumor growth curve. (B) Tumor weight and tumor inhibition rate. (C) Representative tumor tissues. (D) Bodyweight variations in the treatment course. (E) Organ coefficients (* p < 0.05, ** p < 0.01). Reproduced with permission from [128]. Copyright, 2016, ACS.

