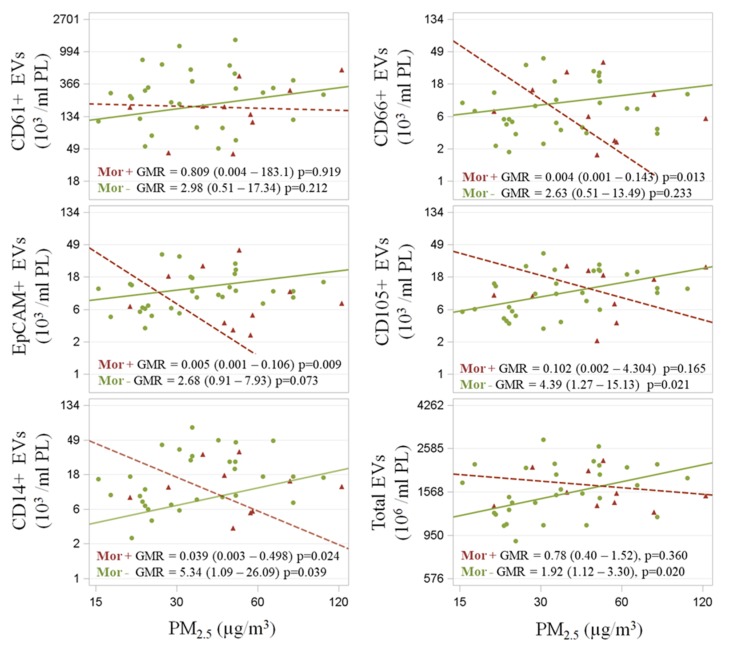
Figure 4.
Association between EV outcomes and PM2.5 exposure. Mor+ and Mor− subjects were represented by crosses and circles, respectively. Scatterplots of EV (103/mL PL) vs. PM2.5 (below) levels (µg/m3). Covariate-adjusted geometric mean ratios and corresponding 95% confidence intervals (GMR (95%CI)) in EV estimated per log10-unit increase in PM are shown. Subjects were stratified according to their Moraxella genus relative abundance into the Mor− (≤25%) and Mor+ (>25%) group. Total EV count obtained via nanoparticle tracking analysis (NTA). EV fraction counts performed via flow-cytometry (FC) analysis.

