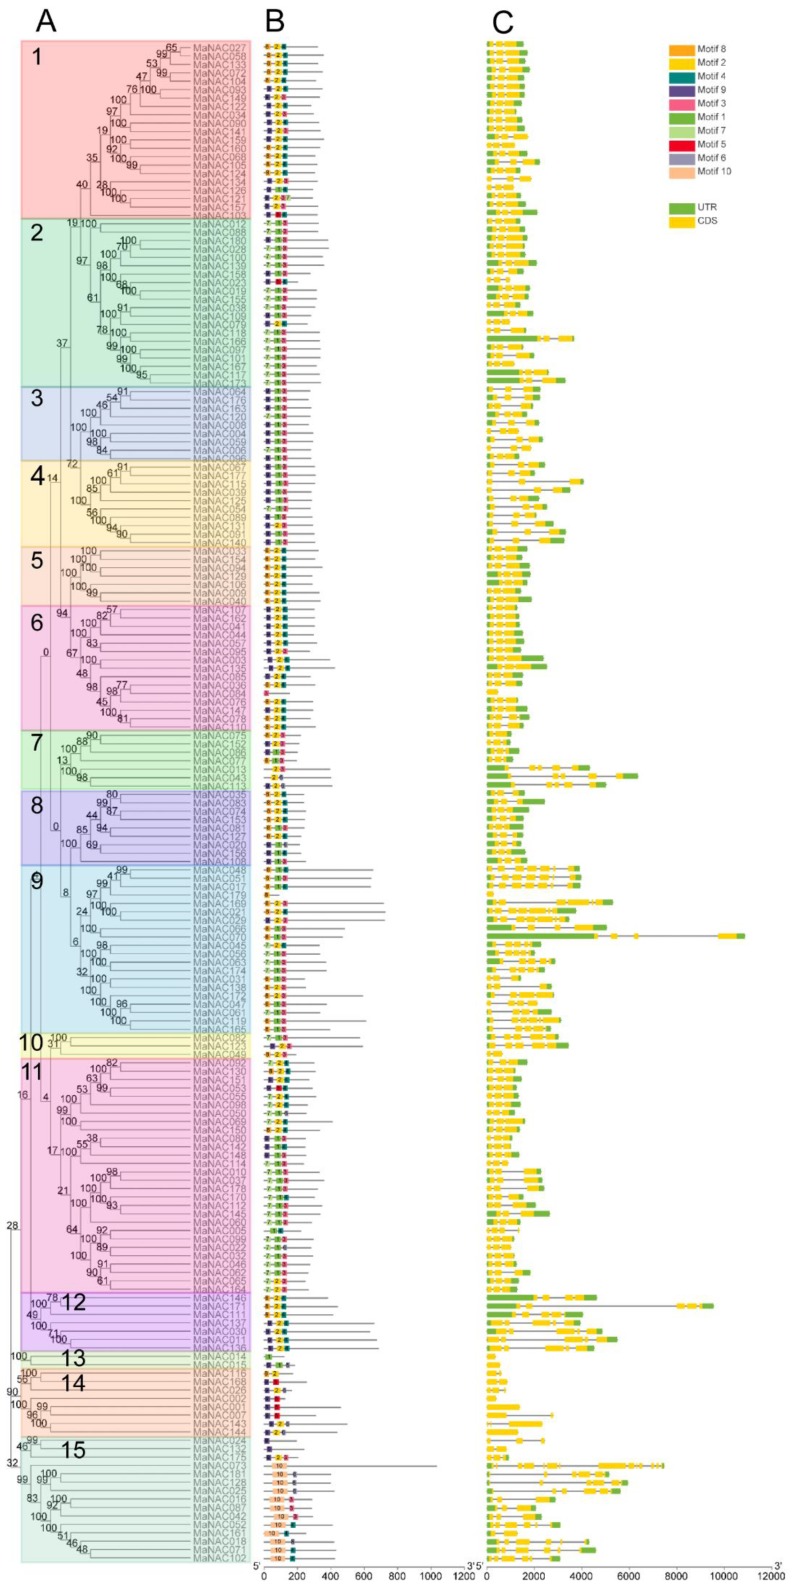
Figure 4.
Phylogenetic relationships, motif compositions, and gene structure of banana NAC genes. (A) Multiple alignments of 181 full-length amino acids of NAC genes from M. acuminata. The evolutionary tree was constructed by the neighbor-joining method using 1000 bootstrap replicates, and the percentage of bootstrap scores was labeled at each node. Each subfamily was designated numerically and marked with individual color backgrounds. (B) Conserved motifs analysis of the MaNAC proteins. All motifs were identified by the MEME database with the complete amino acid sequences of MaNACs. The detailed information for each motif was provided in Figure S1. (C) Gene structure of banana NAC members. Exons and introns are represented by yellow boxes and black lines, respectively, the UTR (Un-Translated Region) is marked in green. The scale for the estimation of the sizes of exons and introns is presented at their bottom.

