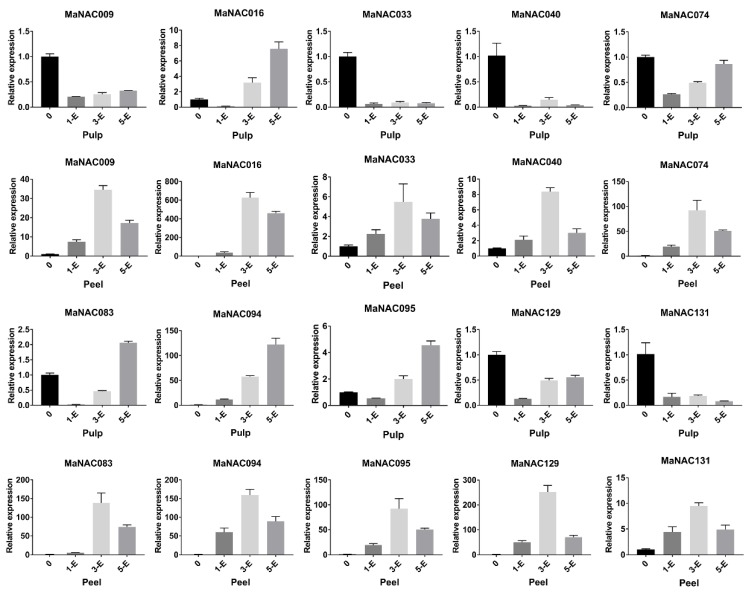
Figure 6.
Relative expression of 10 selected MaNAC genes in the pulp or peel of banana at different intervals after treatment with ethylene (E represents ethylene, the number indicates the days after treatment). qRT-PCR data were normalized using the CAC gene. The name of the gene is indicated above each bar diagram. Error bars indicate the standard deviation.

