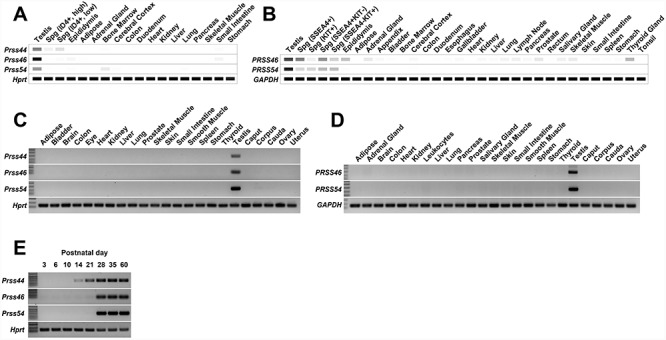
Figure 1.

Patterns of gene expression in mouse and human tissues and organs. (A) Digital PCR depicting the average TPM value per tissue per gene from 77 published mouse RNAseq datasets. White = 0 TPM, Black ≥ 30 TPM. (B) Digital PCR depicting the average TPM value per tissue per gene from 147 published human RNAseq datasets. White = 0 TPM, Black ≥ 30 TPM. (C) Conventional RT-PCR of mouse tissues and organs. (D) Conventional RT-PCR of human tissues and organs. (E) Conventional RT-PCR of mouse testes isolated at the developmental time points.
