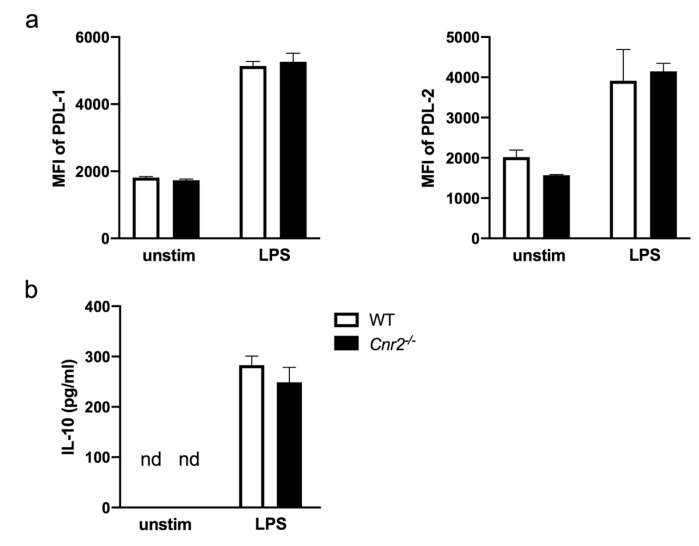
Figure 5.
Equivalent surface expression of programmed death-ligand 1 (PD-L1), PD-L2 and IL-10 production by Cnr2−/− and WT BM-DCs after TLR4 stimulation. (a) Surface expression of PD-L1 and PD-L2 by WT (white bars) or Cnr2−/− (black bars) BM-DCs cultured for 16 h in the absence (unstim) or presence of 100 ng/mL LPS. (b) Production of IL-10 by WT (white bars) or Cnr2−/− (black bars) BM-DCs cultured for 16 h in the absence (unstim) or presence of 100 ng/mL LPS. Data show median fluorescence intensity (MFI) ± SEM (n = 3-4 animals/group).

