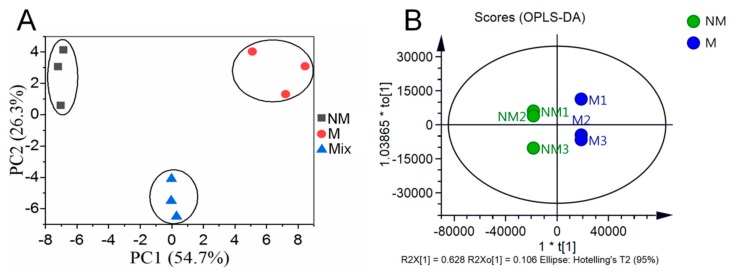
Figure 2.
PCA and OPLS-DA scores plots derived from ultra-performance liquid chromatography-electrospray ionization-tandem mass spectrometry (UPLC-ESI-MS/MS) profiling of non-mycorrhizal A. roxburghii (NM) and mycorrhizal A. roxburghii (M) growth for six months. (A) PCA scores plot of the two samples (NM and M growth for six months) and the quality control sample (mix, the same volume of sample extract from the NM and M growth for six months was prepared by mixing); the x-axis represents the PC1 and the y-axis represents PC2. (B) OPLS-DA scores plot of the putatively annotated metabolites from NM and M growth for six months. The x-axis represents the score value of main components in the orthogonal signal correction process and the differences between the groups can be seen from the direction of the x-axis; the y-axis represents the scores of orthogonal components in the orthogonal signal correction process and the differences within the groups can be seen from the direction of the y-axis.

