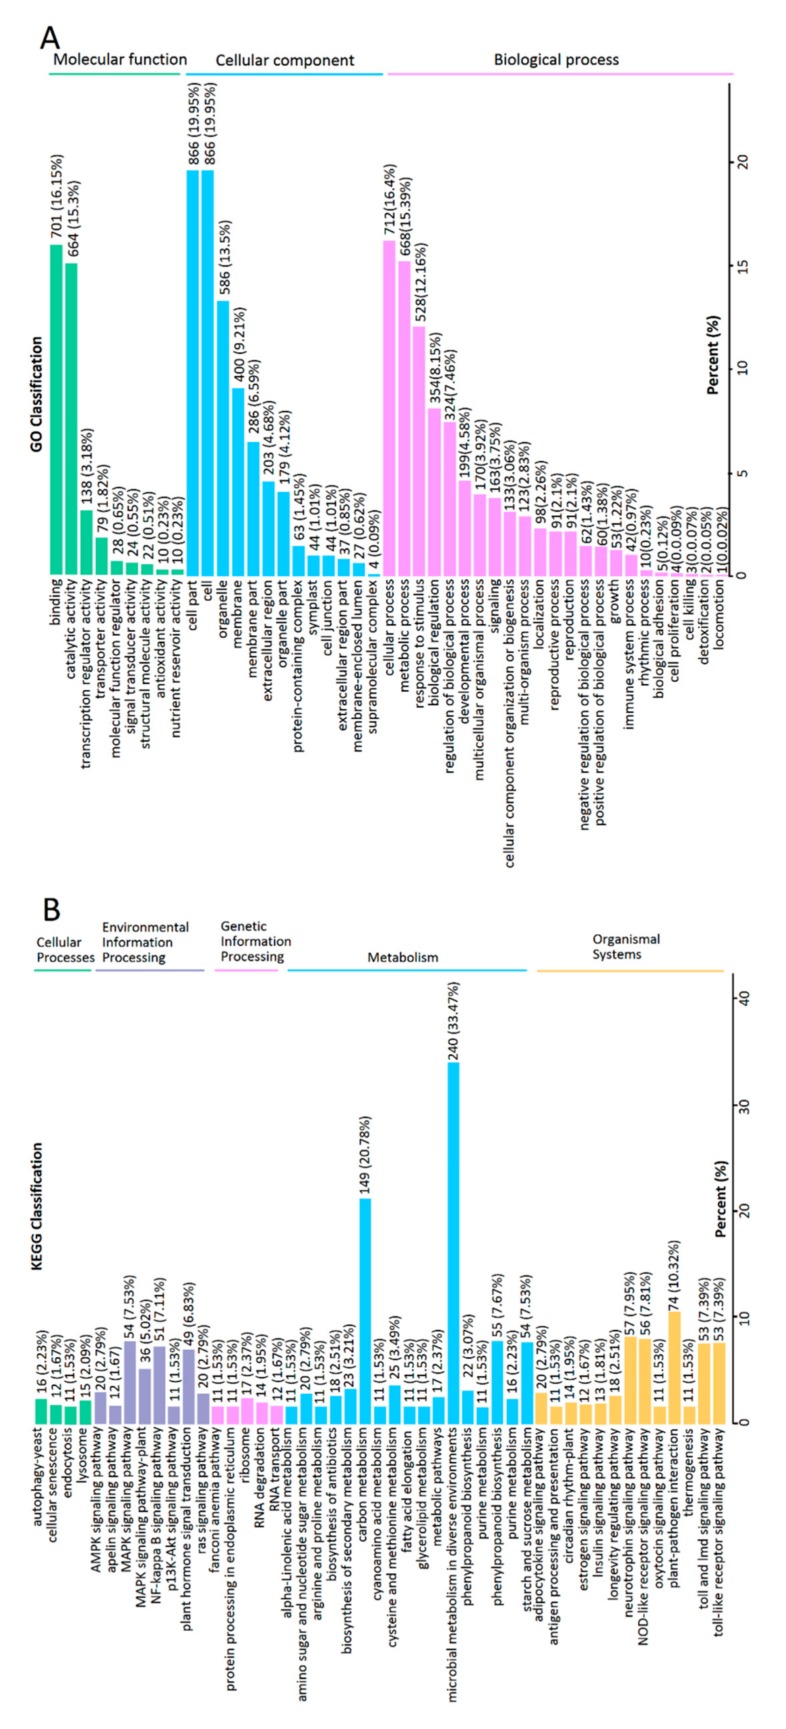
Figure 4.
The classification column of GO and KEGG from the DEGs between the NM and M growth for six months. (A) GO classification of DEGs. The x-axis represents the secondary GO item. The y-axis represents the proportion of the DEGs in the total number of DEGs. The labels above the columns is the number and proportion of DEGs of this GO item. (B) KEGG classification of DEGs. The x-axis represents the name of KEGG pathway. The y-axis represents the proportion of genes annotated to the pathway in the total of annotated genes. The labels above the columns represent the classification of KEGG pathway.

