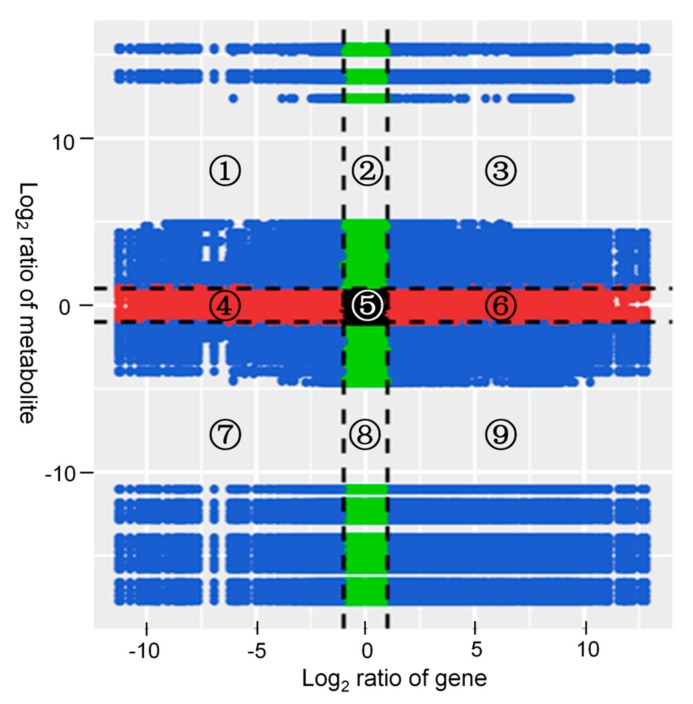
Figure 5.
Quadrant diagrams representing the association of the DAMs and DEGs between the non-mycorrhizal and mycorrhizal A. roxburghii growth for six months. The x-axis represents that the log2 ratio of gene and the y-axis represents the log2 ratio of metabolite; black dotted lines represent the different threshold; each point represents a gene or metabolite; black dots represent the unchanged genes or metabolites; green dots represent differentially accumulated metabolites with unchanged genes; red dots represent differentially expressed genes with unchanged metabolites; blue dots represent both differentially expressed genes and differentially accumulated metabolites; it is divided into ①–⑨ quadrants from left to right and from top to bottom with black dotted lines; the ①, ② and ④ quadrants indicate that the expression abundance of metabolites is higher than that of genes; the ③ and ⑦ quadrants indicate that the expression patterns of genes are consistent with the metabolites; the ⑤ quadrant indicates that the genes and metabolites are not differentially expressed; the ⑥, ⑧ and ⑨ quadrants indicate that the expression abundance of metabolites is lower than that of genes.

