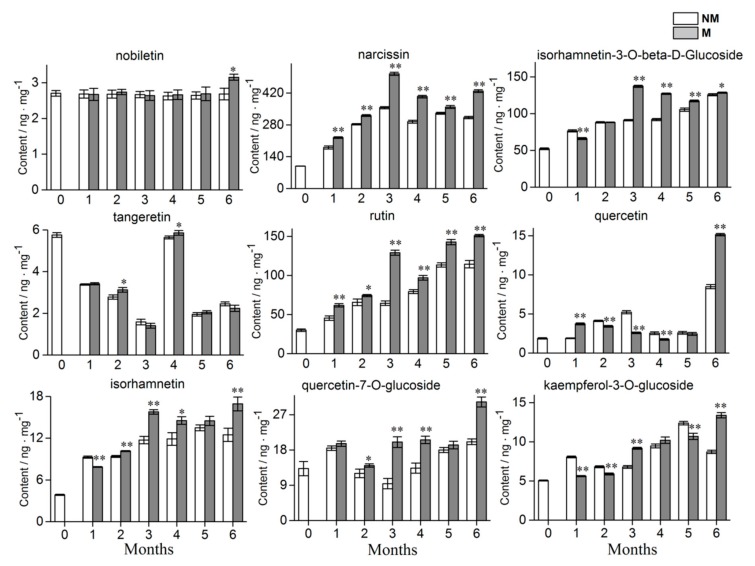
Figure 7.
Dynamic variations of 9 flavonoids in the mycorrhizal and non-mycorrhizal A. roxburghii growth 0 month to 6 months. NM and M represents non-mycorrhizal A. roxburghii and mycorrhizal A. roxburghii, respectively. Each value is the mean of three replicates, and error bars indicate standard deviations. Statistical analysis of the data was performed by independent samples t-test using the SPSS 22.0 software (IBM, Chicago, IL, USA). * and ** above the columns are significantly different at p ≤ 0.05 and p ≤ 0.01, respectively.

