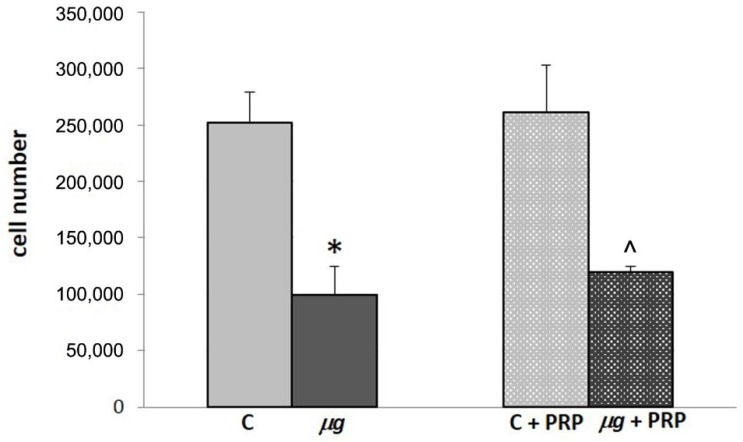
Figure 8.
Effect of PRP treatment on NIH-3T3 cells exposed to modeled µg: cell count. Cells were exposed to modeled µg or maintained at 1× g (controls = C) for 72 h in the presence/absence of PRP (1:1000). At the end of exposure, cells were collected and counted with a Burker’s chamber. * p < 0.05 vs. C, ^ p < 0.05 vs. C + PRP, (n = 3).

