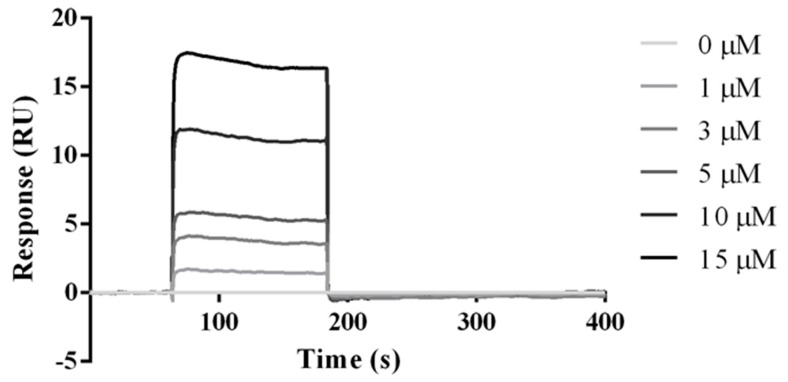
Figure 6.
SPR analysis of the BTLA protein binding to the HVEM (14–39) peptide. Sensorgrams show the results of SPR analysis conducted on the binding of the indicated concentrations of BTLA protein (C = 0, 1, 3, 5, 10, and 15 μM) in HBS-EP buffer. Constants were determined based on four measurements: k1 = 7.64 × 10⁴ 1/Ms ± 6.81 × 10⁴; k−1 = 3.32 × 10⁻³ 1/s ± 1.55 × 10⁻³; KD = 1.02 × 10⁻⁷ M ± 0.97 × 10⁻⁷, where k1 is the association rate constant, k−1 is the dissociation rate constant, and KD = k1/k−1.

