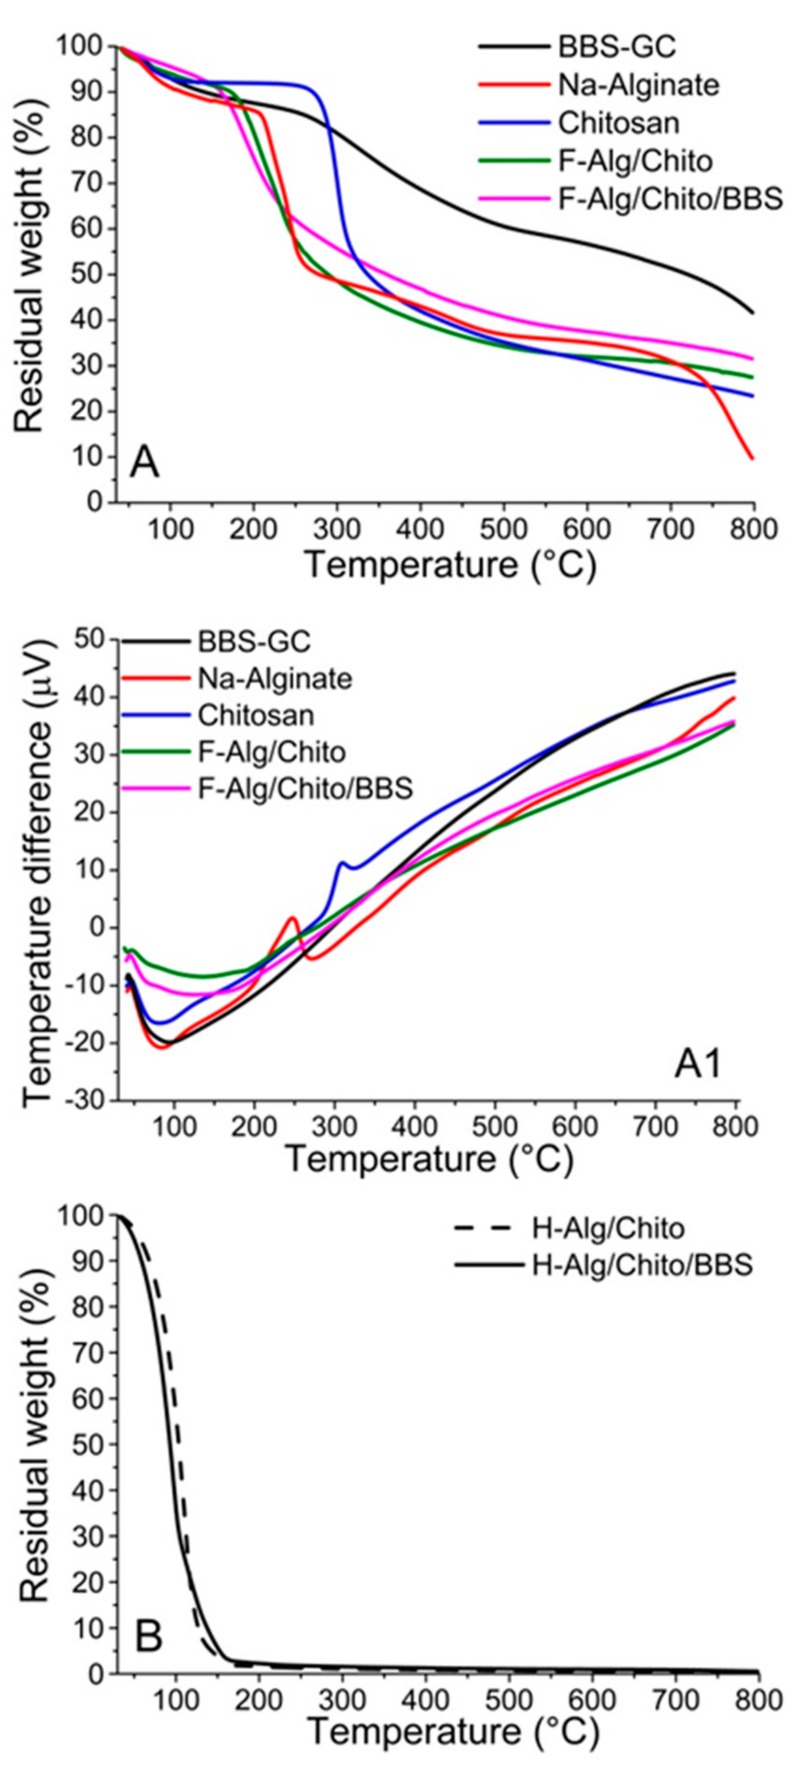
Figure 3.
(A) Thermal gravimetrical analysis (TGA) and (A1) Differential thermal analysis (DTA) profiles of BBS-GC (black curve), sodium alginate (red curve), chitosan (blue curve), F-Alg/Chito (green curve) and F-Alg/Chito/BBS (magenta curve); (B) TGA profiles for hydrogels: H-Alg/Chito/BBS (solid curve) and H-Alg/Chito (dashed curve).

