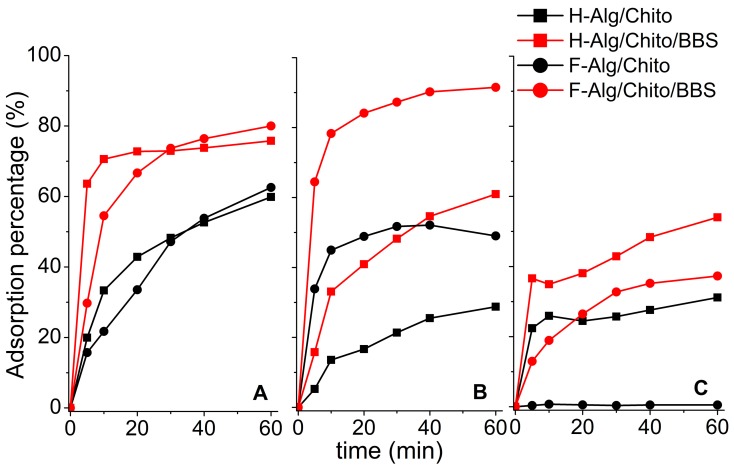
Figure 8.
Adsorption percentages of both hydrogels and dried films towards different substrates: (A) crystal violet - CV, (B) rhodamine B - RH, and (C) orange II – OII at initial dye concentration of 10 mg L−1. Legend: H-Alg/Chito (black squares, black line), H-Alg/Ca/BBS (red squares, red line), F-Alg/Chito (black circles, black line), and F-Alg/Chito/BBS (red circles, red line). Adsorption percentages were calculated by means of UV-VIS spectroscopy, considering the adsorption peak decrease respect to the bare solution at time 0. Wavelengths selected were 590 nm (CV), 555 nm (RH), and 485 nm (OII).

