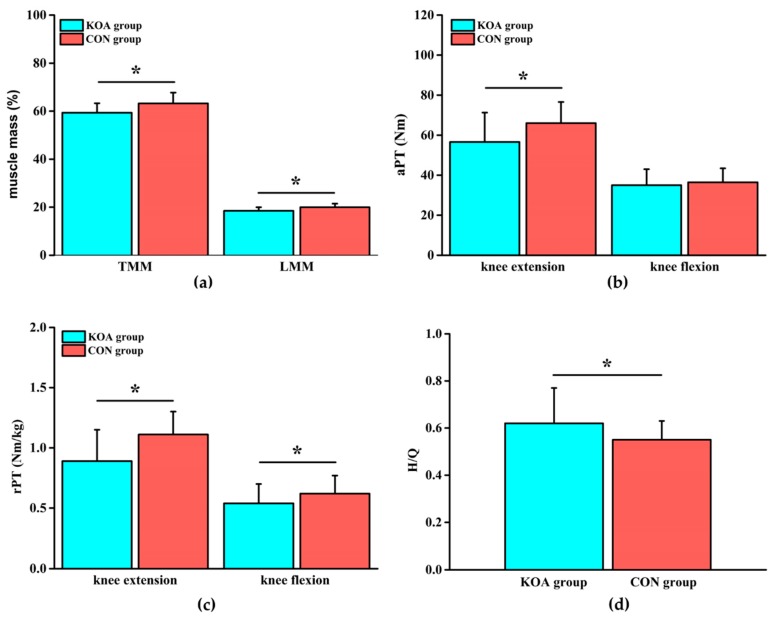
Figure 2.
(a) Comparison of the muscle mass (total muscle mass (TMM) and lower limbs muscle mass (LMM)) between the KOA and control group (CON) groups; (b) comparison of the absolute peak torque (aPT) of the knee joint between the KOA and CON groups; (c) comparison of the relative peak torque (rPT) of the knee joint between the KOA and CON groups; and (d) comparison of the relative peak torque ratio (H/Q) of knee flexion and extension between the KOA and CON groups. * means p < 0.05.

