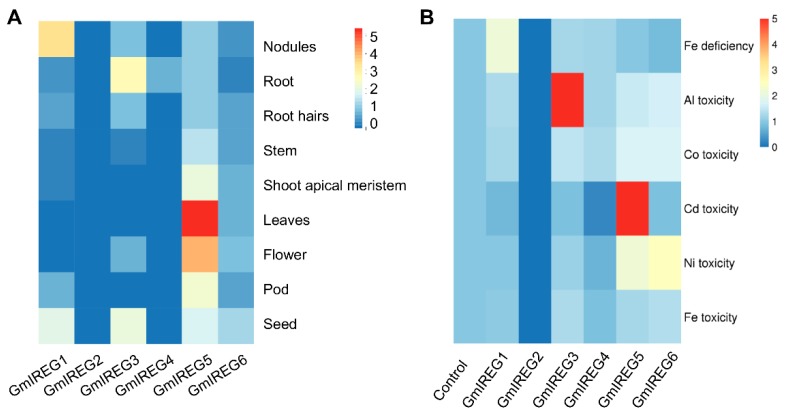
Figure 2.
Tissue-specific expression and metal-induced expression patterns of six soybean IREG genes. (A) Heat map analysis shows the different tissue specific expression pattern of GmIREGs using the PKFM data of phytozome v12 database. (B) Expression of GmIREGs in response to Fe deficiency, Al toxicity, Co toxicity, Cd toxicity, Ni toxicity, and Fe toxicity. For Fe deficiency, uniform seedlings were exposed to normal conditions (half-strength nutrient solution, pH 5.6) or low-iron conditions (half-strength nutrient solution without Fe-Na-EDTA, pH 5.6) for 14 days. For other toxicity treatments, the uniform seedlings were treated with excess Fe (1000 µM Fe-EDTA), Ni (30 µM NiCl2·6H2O), Cd (30 µM CdCl2), Co (30 µM CoCl2), and Al (30 µM AlCl3·6H2O) treatments for 12 h. The roots were separately harvested for qRT-PCR analysis. The heat map displays 2ΔΔCt values to show relative expression of metal treated samples vs. controls.

