Figure 5.
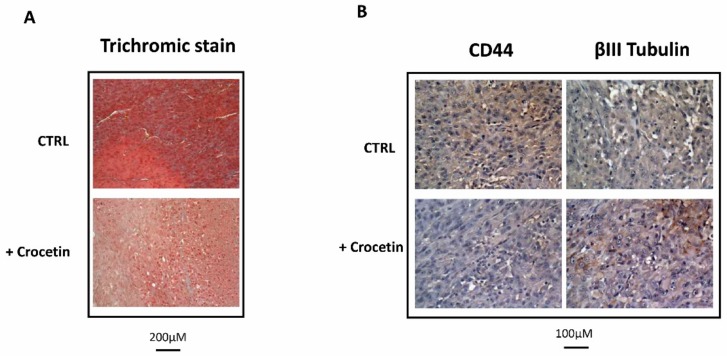
Histological and immunohistological analyses performed in tumors that were grown in the presence of a vehicle or CCT. (A) Trichromic staining performed at 20× magnification (bar represents 200 μm) and (B) CD44 and βIII tubulin expression on images harvested at 40× magnification. Bar represents 100 μm.

