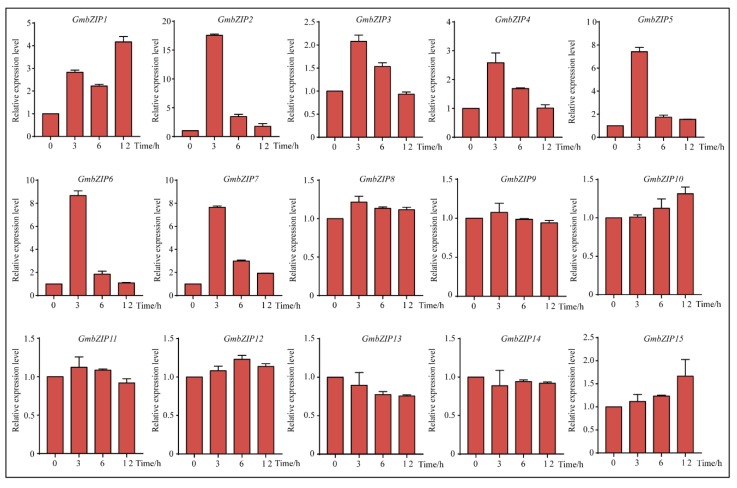
Figure 6.
Expression patterns of the 15 GmbZIP genes under salt treatment. qRT-PCR data are normalized using soybean Actin (U60506) and displayed as relative to 0 h. The X-axes show time periods and y-axes depict scales of relative expression level (error bars indicate SD).

