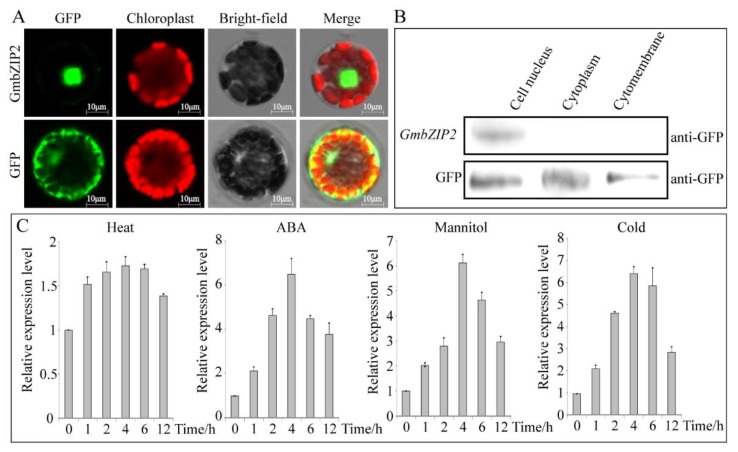
Figure 7.
GmbZIP2 subcellular localization and expression patterns under different stresses. (A) Subcellular localization analysis of GmbZIP2 protein. The scale bar was shown by 10 μm. (B) Western blot detection analysis of GmbZIP2 protein subcellular localization. (C) The expression patterns of GmbZIP2 under different stresses. Vertical bars in C indicate ± SE of three replicates.

