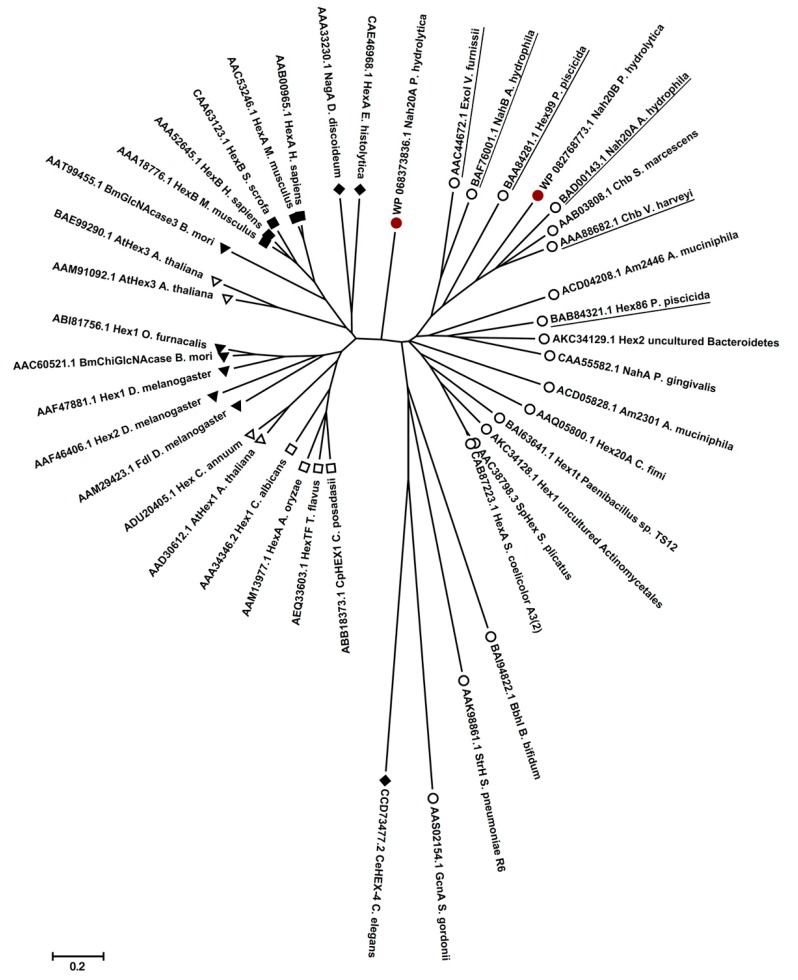
Figure 2.
Schematic phylogenetic tree of PhNah20A, PhNah20B (both marked with red circles) and 41 biochemically characterized GH20 (EC 3.2.1.52) enzymes. Evolutionary analyzes were conducted, and the tree was composed and visualized using MEGA v 7.0.26 [55]. Protein sequences were aligned with Clustal Omega and the BLOSUM62 protein weight matrix was used. Evolutionary relationships were calculated using the Neighbor-Joining method. Evolutionary distances were computed using the Poisson correction method. All positions containing gaps and missing data were eliminated, and there was in total 292 positions in the final dataset. The tree is in scale with branch lengths in the same units as those of the evolutionary distances used to infer the phylogenetic tree. Bacterial (○), fungal (□), plant (Δ), insect (▲) and mammal (■) sequences. Amoebae and C. elegans sequences are marked with a filled diamond (♦). Characterized GH20 enzymes from marine organisms are underlined.

