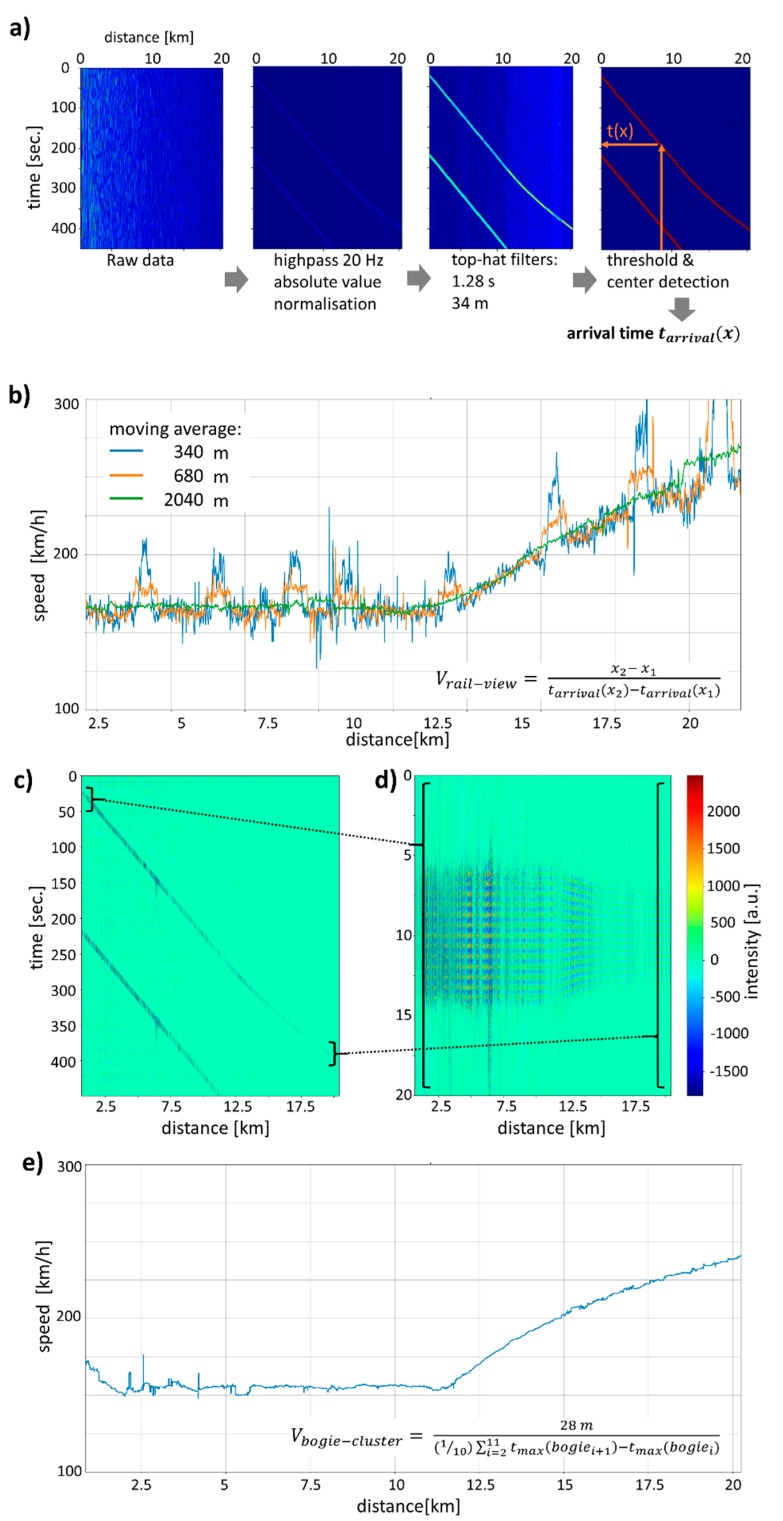
Figure 3.
‘Rail-view’ analysis of the DAS data at fixed positions as a function of time. (a) Filtering and center detection are similar to Figure 2a, however, the train arrival time tarrival(x) is determined here. (b) From the rail-view data, the train speed is calculated and shown for different averaging lengths. Peaks in the velocity are due to fiber loops. (c,d) Arranging the 20 Hz filtered data in (c) such that the arrival times are aligned results in a ‘rail-view’ plot (d). From the distance of the bogie cluster stripes in (d), the bogie cluster velocity is determined (e).

