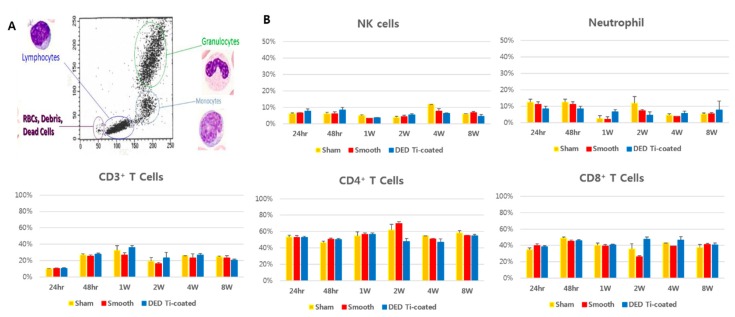
Figure 7.
The results of in vivo immune profiling of blood samples. (A) Categorized into a specific group of inflammatory cells based on measurements according to the established criteria. (B) The results of the immune profiling assay. There were no statistically significant differences in all type of inflammatory cell among three experimental groups. The ratio of CD3+ T cell increased between 1 and 2 weeks, then decreased to normal levels. This increase was also measured in sham group without implanting specimens.

