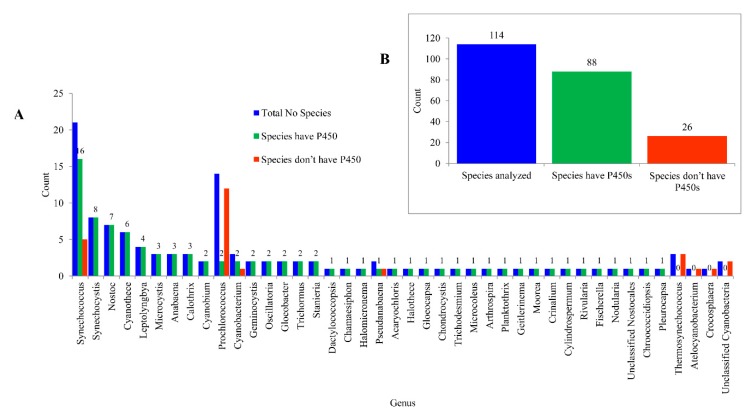
Figure 1.
Analysis of P450s in Cyanobacteria. P450s were analyzed at both the genus level (A) and species level (B). The numbers next to the bars indicate the number of species. In Panel A, only species numbers for the species that have P450s are presented. Detailed information is presented in Tables S1 and S2.

