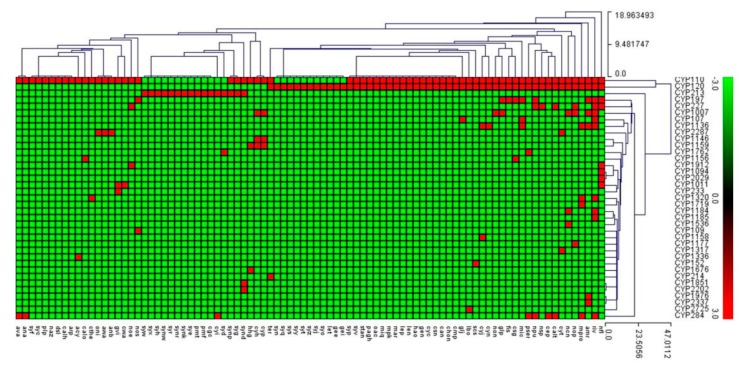
Figure 5.
Heat-map of the presence/absence of P450 families in 88 cyanobacterial species. The data is represented as 3 for family presence (red) and –3 for family absence (green). Eighty-nine cyanobacterial species form the horizontal axis and P450 family numbers form the vertical axis. A detailed table showing P450 family profiles in each of the cyanobacterial species is presented in Supplementary Dataset 3.

