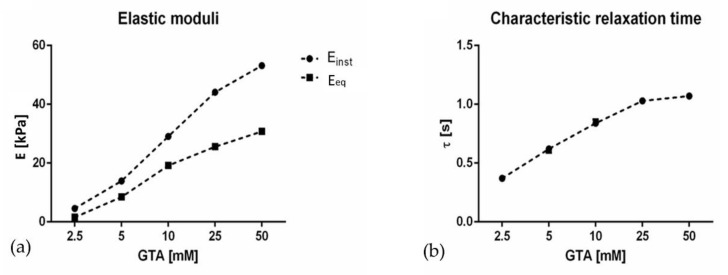
Figure 2.
(a) Instantaneous Einst) and equilibrium (Eeq) elastic moduli and (b) characteristic relaxation times of gelatin hydrogels as a function of glutaraldehyde (GTA) concentration. The dashed lines represent linear data interpolation and serve only as a guide to the eye. Error bars are scarcely visible due to their very low values (SEM values are reported in the Supplementary Materials).

