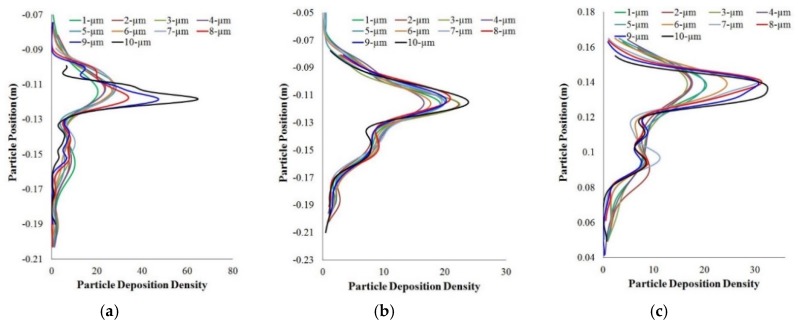
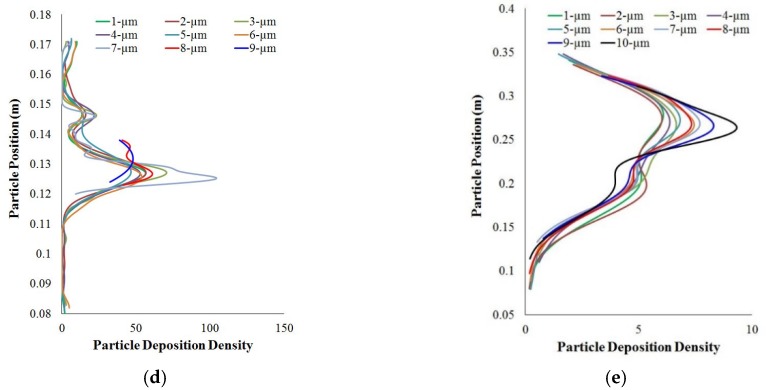
Figure 8.
Particle deposition density comparison at different lobes of a 17-generation lung model. (a) right upper; (b) right middle; (c) right lower; (d) left upper; (e) left lower. Particle deposition density is the number of deposited particles and deposition concentration is calculated along the y-axis of the corresponding lobes [183].


