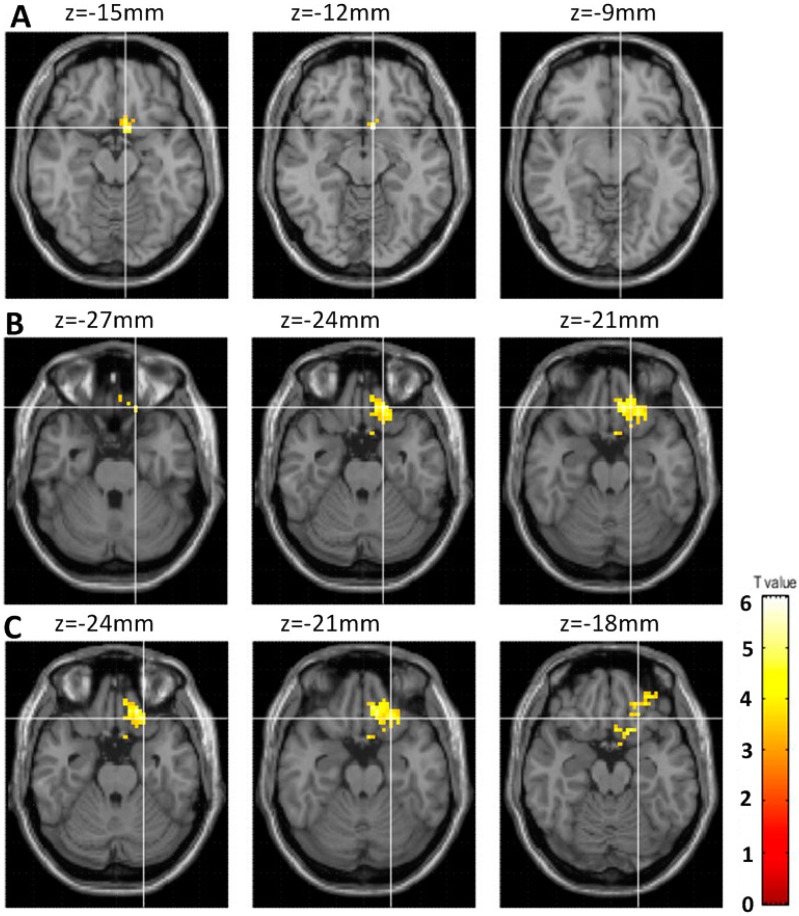
Figure 2.
Regions showing differences in the changes of brain activity between the pro-gamer group and IGD adolescent group. (A) left subcallosal gyrus (x, y, z, −6, 12, −1), (B) left orbital gyrus (x, y, z, −15, 33, −24), (C) left inferior frontal gyrus (x, y, z, −21, 27, −21), yellow regions: the IGD adolescent group showed increased brain activity compared to the pro-gamers group.

