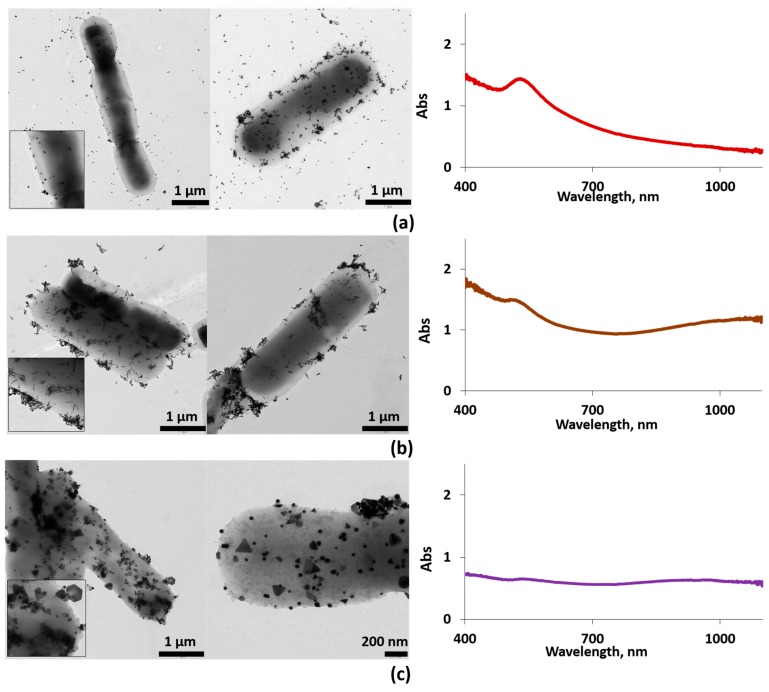
Figure 3.
Left column: typical EM images for AuNSs–ferment (a), AuNRs–ferment (b), and AuNPRs–ferment (c). Several EM images are shown for each sample. Insets: zoom of the EM images. Right column: the corresponding UV-vis spectra of each sample, AuNSs–ferment (a), AuNRs–ferment (b), and AuNPRs–ferment (c).

