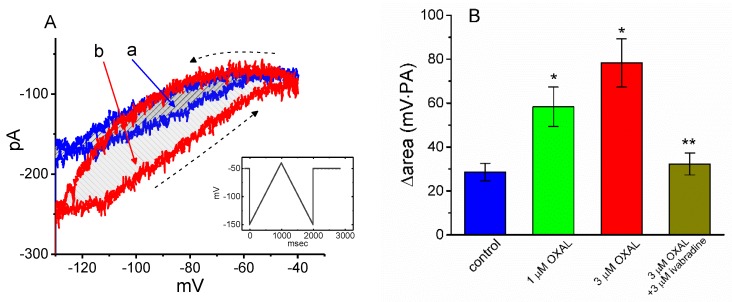
Figure 4.
The effect of OXAL on the voltage-dependent hysteresis measured from GH3 cells. (A) Representative current trace elicited by long-lasting, 2 s triangular (i.e., upsloping and downsloping) ramp pulse between −150 and −40 mV. Insert in (A) is the voltage protocol applied during the recordings. (A) Voltage hysteresis (i.e., forward or reverse current versus voltage relationship) of Ih measured in the absence (a) and presence of 3 μM OXAL (b). Arrow depicts the direction of ramp-elicited Ih in which time passes. The current trace labeled a was the control and that labeled b was taken in the presence of 3 μM OXAL. (B) Summary bar graph showing the effect of OXAL and OXAL plus ivabradine on the Δarea (as indicated in shaded area in (A)) of voltage hysteresis (mean ± SEM; n = 9 for each bar). ΔArea taken with or without addition of OXAL is indicated as shaded area in (A). * Significantly different from control (p < 0.05) and ** significantly different from 3 μM OXAL alone group (p < 0.05).

