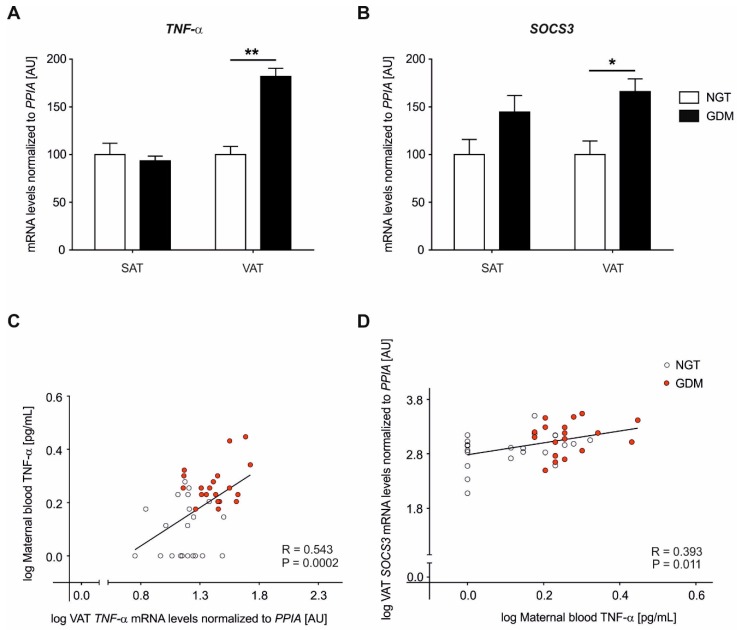
Figure 1.
Relative mRNA levels of TNF-α and suppressor of cytokine signaling 3 (SOCS3) in subcutaneous adipose tissue (SAT) and visceral adipose tissue (VAT) of women with GDM vs. NGT. Relative gene expression of TNF-α (A) and SOCS3 (B) was normalized to peptidylprolyl isomerase A (PPIA) in abdominal SAT and omental VAT, of women with GDM (n = 19, black) vs. NGT women (n = 22, white). Data are means ± SEM, shown as percentage to NGT levels. A.U., arbitrary units. TNF-α VAT ** P < 0.0001, SOCS3-VAT * P = 0.01. (C–D) Pearson’s correlation coefficients (R) calculating the relationship between maternal blood TNF-α levels and VAT gene expression data. NGT: open circles, GDM: red circles. Statistical significance between groups (A,B) and for correlations (C,D) remained after adjustment for prepregnancy body-mass-index (BMI) and BMI at delivery.

