Figure 3.
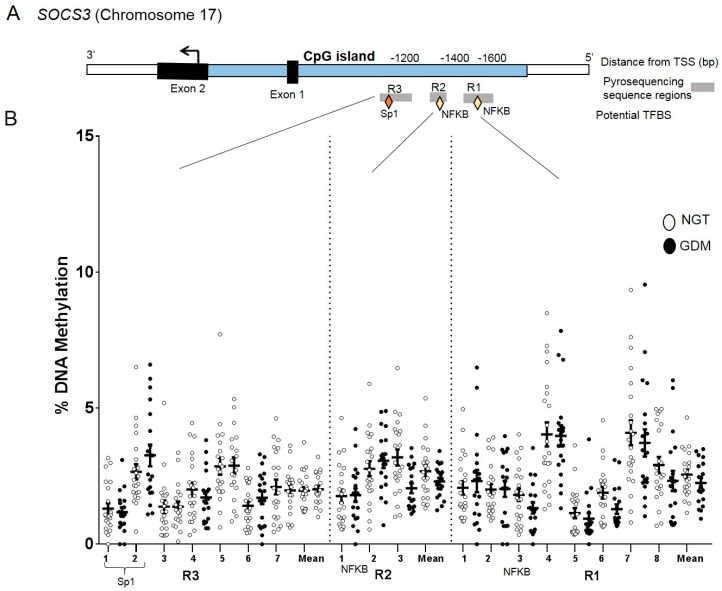
DNA methylation analysis in the SOCS3 promoter region. CpG site-specific DNA methylation analyses at SOCS3 within the promoter region in visceral adipose tissue from mothers with NGT vs. GDM. (A) Schematic illustration of the DNA methylation assays (R1, R2, and R3) for the SOCS3 promoter region, including potential transcription factor binding sites (TFBS) Sp1, NFKB (diamonds) and within the CpG island (blue). (B) Percent DNA methylation at each individual CpG site investigated (18 CpG sites) in VAT of NGT (white; n = 22) vs. GDM group (GDM; black; n = 19). The overall mean across CpG sites is also included. Data are means ± S.E.M. TSS: Transcriptional start site, bp: base pairs.

