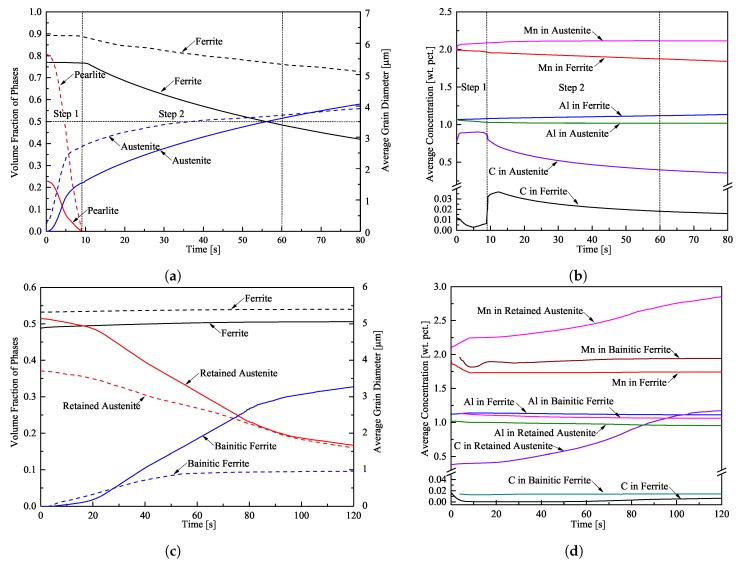
Figure 2.
Temporal variation of (a) the volume fraction (solid lines) and average grain diameter (dashed lines) of ferrite, pearlite, and austenite, (b) average concentration of C, Al, and Mn in ferrite and austenite during intercritical annealing at 890 °C, (c) the volume fraction (solid lines) and average grain diameter (dashed lines) of ferrite, retained austenite, and bainitic ferrite, and (d) average concentration of C, Al, and Mn in ferrite, retained austenite, and bainitic ferrite during isothermal bainitic treatment at 400 °C.

