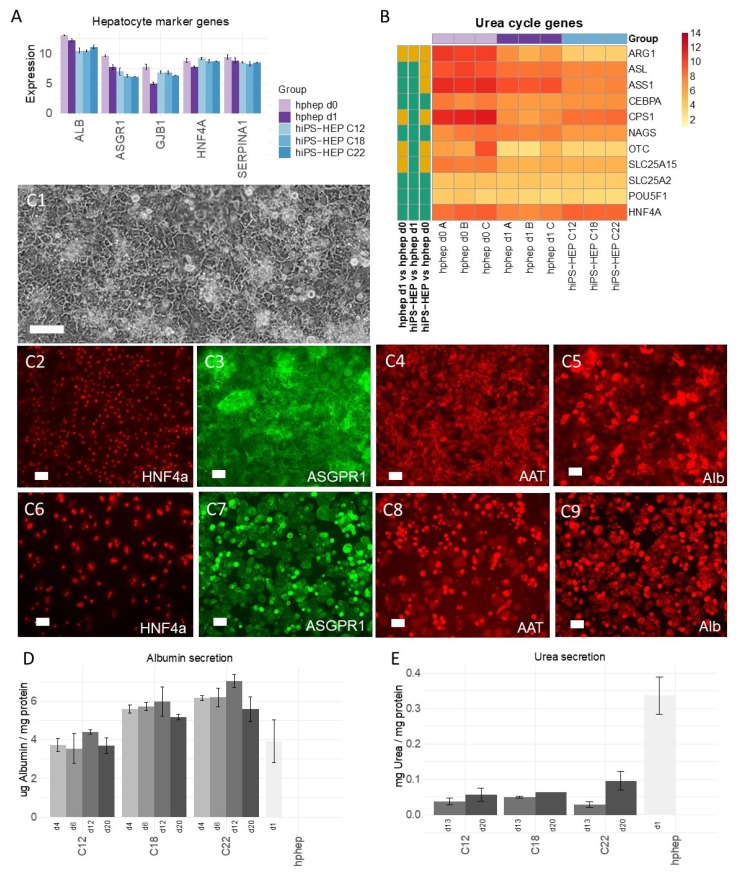
Figure 1.
Expression of general hepatocyte markers and functions in human induced pluripotent stem cell-derived hepatocytes (hiPS-HEP). (A) mRNA expression of the general hepatocyte markers albumin (ALB), asialoglycoprotein receptor 1 (ASGPR1), connexin 32 (GJB1), hepatocyte nuclear factor 4α (HNF4α), and α1-antitrypsin (AAT) in hiPS-HEP derived from three human induced pluripotent stem cell (hiPSC) lines (ChiPSC12, ChiPSC18, ChiPSC22) on day 13 post-thawing and human primary hepatocytes (hphep) directly after thawing (d0) and on day 1 post-thawing (d1). Error bars represent standard deviation of different cell batches for hiPS-HEP (n = 2 batches) and different donors for hphep (n = 3 donors), respectively. (B) Heatmap of mRNA expression of urea cycle genes in hiPS-HEP derived from three hiPSC lines (ChiPSC12, ChiPSC18, ChiPSC22) on day 13 post-thawing (n = 2 batches per hiPSC line) and hphep directly after thawing (d0) and on day 1 post-thawing (d1). The panel to the left of the heatmap indicates significant differences between the groups (adj. p-value < 0.05, absolute log2 fold change > 2; green = no significant difference, orange = significant difference). (C) Representative phase contrast picture of hiPS-HEP derived from ChiPSC18 on day 4 post-thawing (C1), and pictures of immunocytochemistry (ICC) stainings of the hepatocyte markers Hepatocyte Nuclear Factor 4α (HNF4α), Asialoglycoprotein receptor 1 (ASGPR1), α1-Antitrypsin (AAT), and Albumin (Alb) in hiPS-HEP derived from ChiPSC18 on day 12 post-thawing (C2–C5) and hphep cultured for 24 h (C6–C9). Scale bars 100 µm in (C1) and 50 µm in (C2–C9). (D) Albumin secretion in hiPS-HEP derived from three hiPSC lines (ChiPSC12, ChiPSC18, ChiPSC22) on days 4, 6, 12, and 20 post-thaw compared to hphep cultured for one day (d1) post-thaw. Error bars represent standard deviation of duplicate wells per group. (E) Urea secretion in hiPS-HEP derived from three hiPSC lines (ChiPSC12, ChiPSC18, ChiPSC22) on days 13 and 20 post-thaw compared to hphep cultured for one day (d1) post-thaw. Error bars represent standard deviation of duplicate wells per group.

