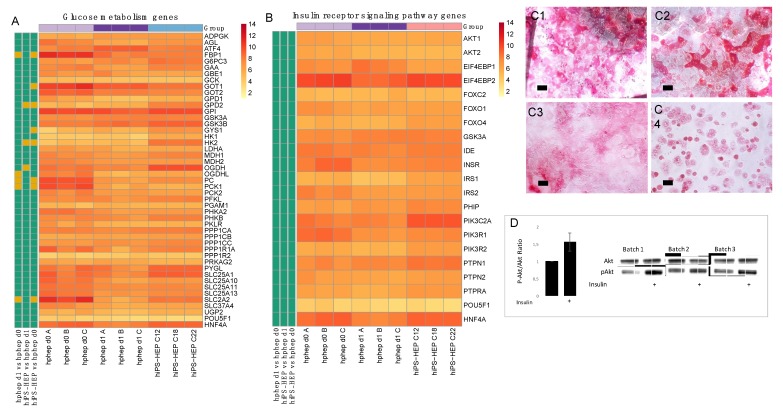
Figure 3.
Glucose metabolism and insulin receptor signaling in hiPS-HEP. (A–B) Heatmap of mRNA expression of genes involved in glucose metabolism (A) and insulin signaling (B) in hiPS-HEP derived from three hiPSC lines (ChiPSC12, ChiPSC18, ChiPSC22) on day 13 post-thawing and hphep directly after thawing (d0) and on day 1 post-thawing (d1). The panel to the left of the heatmap indicates significant differences between the groups (adj. p-value < 0.05, absolute log2 fold change > 2; green = no significant difference, orange = significant difference). (C) Representative pictures of periodic acid Schiff staining of Glycogen deposition in hiPS-HEP derived from ChiPSC12 (C1), ChiPSC18 (C2), and ChiPSC22 (C3) on day 12 post-thawing and hphep cultured for 24 h (C4). Scale bars 50 µm. (D) Western blot detection of Ak strain transforming (AKT) and phosphorylated AKT (pAKT) in hiPS-HEP after a 10 min incubation with 100 nM insulin (as indicated by plus sign) or without 100 nM insulin, respectively. The ratio of pAKT and total AKT was calculated for three batches of hiPS-HEP derived from ChiPSC18 on day 12 post-thawing and is presented as fold change compared to the control cells without insulin stimulation. Error bars represent standard deviation of different cell batches for hiPS-HEP (n = 3 batches).

