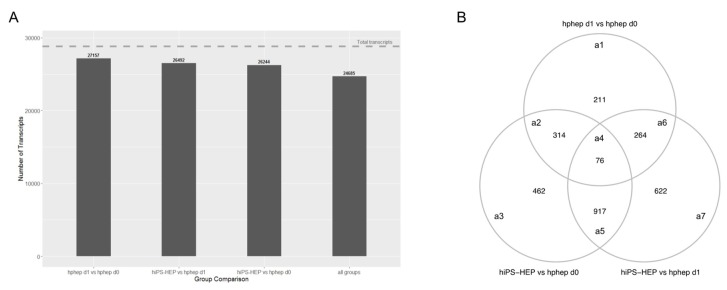
Figure 6.
Global gene expression analysis of transcriptomics data. (A) Number of similarly expressed mRNA transcripts for the different group comparisons. (B) Venn diagram of 2866 differentially expressed genes (DEGs) between the different group comparisons: hphep d0 vs. hphep d1 (area a1), hphep d0 vs. hiPS-HEP (area a3), hphep d1 vs. hiPS-HEP (area a7), hphep d0 vs. hphep d1 and hphep d0 vs. hiPS-HEP (area a2), hphep d0 vs. hiPS-HEP and hphep d1 vs. hiPS-HEP (area a5), hphep d0 vs. hphep d1 and hphep d1 vs. hiPS-HEP (area a6), and all three groups (area a4).

