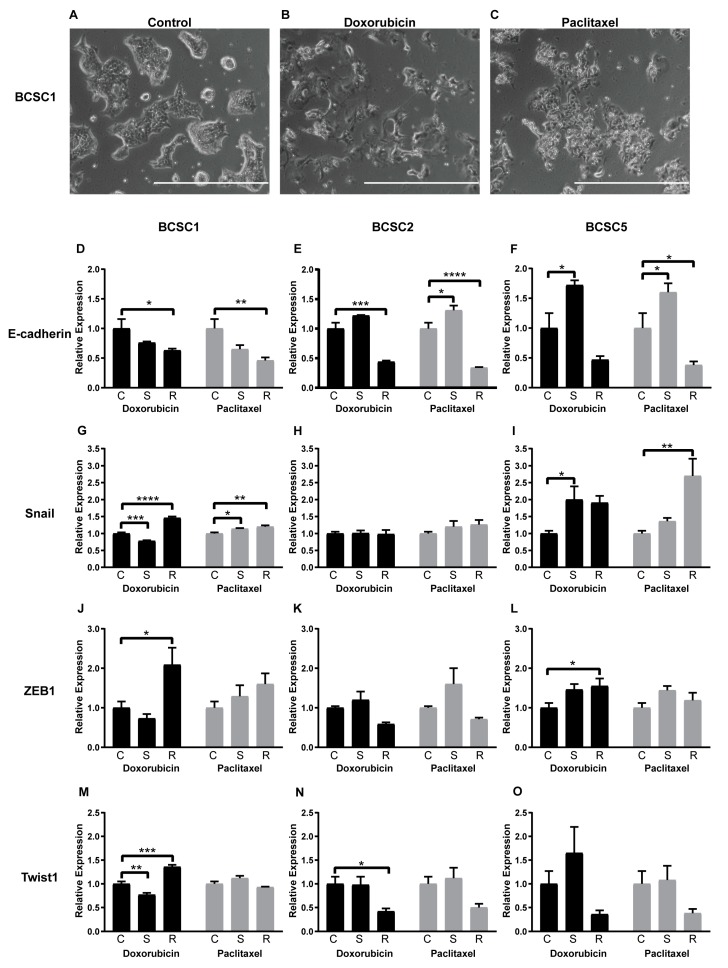
Figure 4.
Chemotherapeutic stress changed the cell morphology and the EMT gene expression of the BCSCs at mRNA level. (A) Cell morphology of BCSC1. (B,C) Morphological changes of BCSC1 exposed to doxorubicin (B) and paclitaxel (C), scale bar 1000 μm. (D–O) EMT factor expression fold change at mRNA level for surviving (S) and recovered (R) BCSCs from doxorubicin or paclitaxel treatment, compared with untreated control cells (C). The n = 3, and data represent means + SEM. * = p < 0.05; ** = p < 0.01; *** = p < 0.001; **** = p < 0.0001 by two-way ANOVA.

