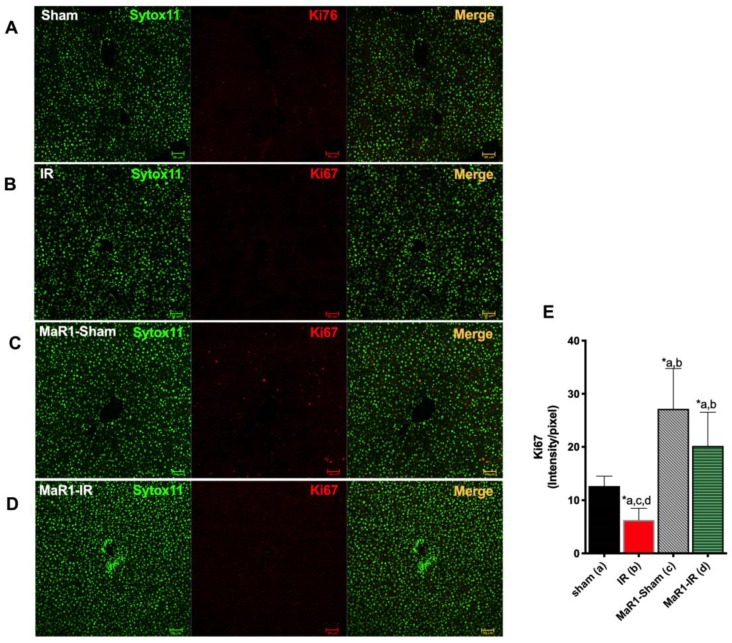
Figure 4.
Effect of MaR1 on cell proliferation measure thought Ki67 immunofluorescence red signal and nuclei in green (SytoxTM Green 11). Representative images of (A) sham, (B) IR, (C) MaR1-IR, and (D) MaR1-IR. (E) The Ki67 signal intensity was evaluated. The plot is represented as mean ± SEM, n = 4 rats per experiment, Image fields measured per rats >6. Significance was assessed by one-way ANOVA and the Tukey’s post-test. Asterisk indicates p < 0.05, and the letters identify the experiments that are compared and present this statistical difference. Scale bar indicates 50 µm.

