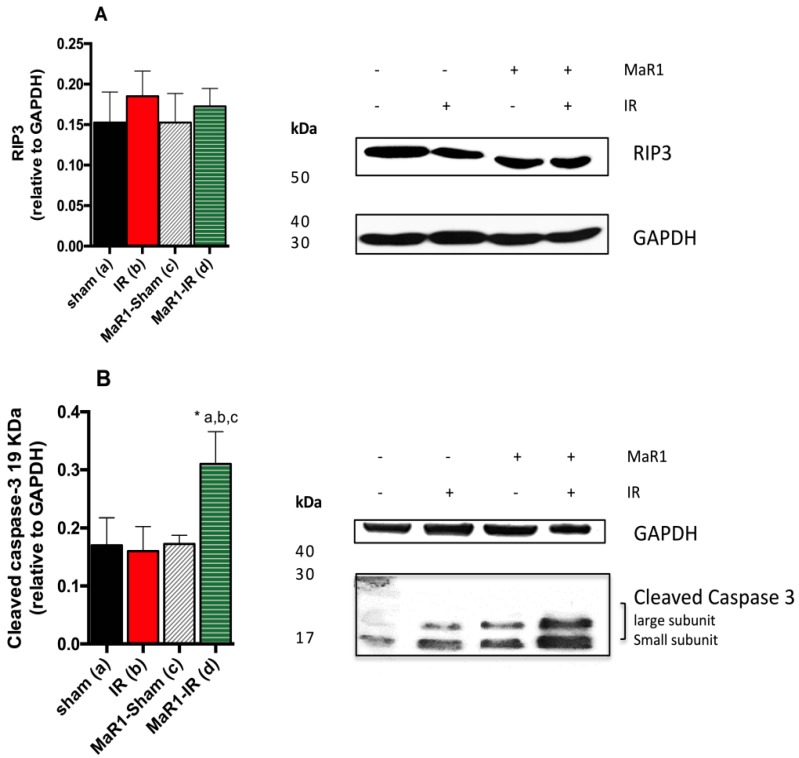
Figure 5.
Effect of MaR1 after IR on tissue levels of (A) RIP3 and (B) cleaved caspase-3 protein expression levels. The values were quantified relative to glyceraldehyde 3-phosphate deshydrogenase (GAPDH). n = 4 rats per experimental group. Asterisk indicates p < 0.05, and the letters identify the experiments that are compared and present this statistical difference.

