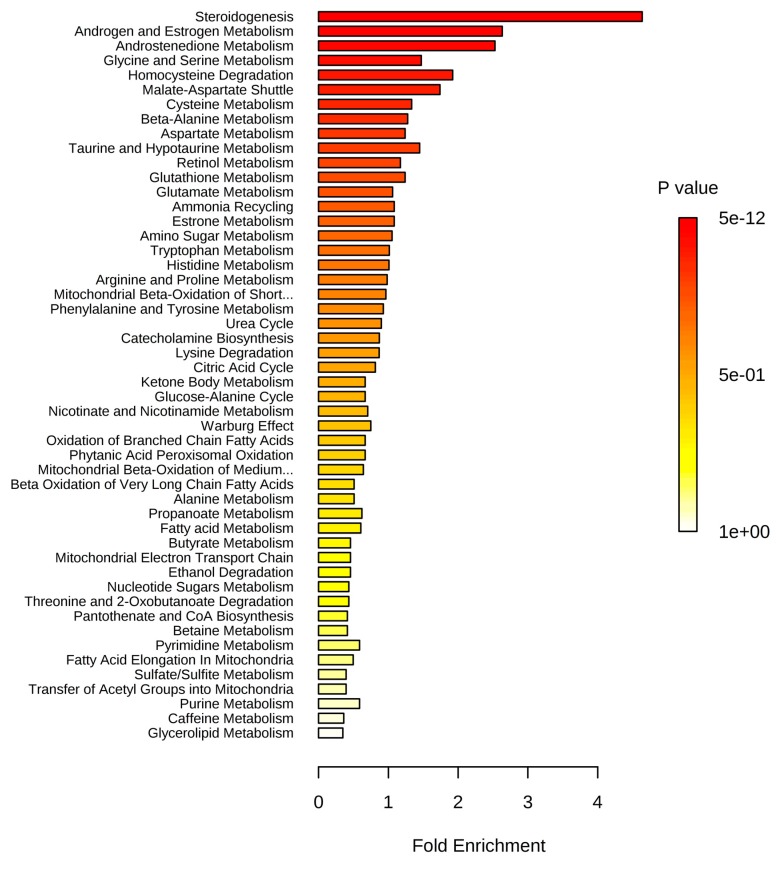
Figure 2.
Summary plot for over-representation analysis (ORA) of blood plasma metabolites with an abnormal concentration in obese patients (stage 3). Information on the total number of metabolites in the pathways and other statistics are presented in Table S6.

