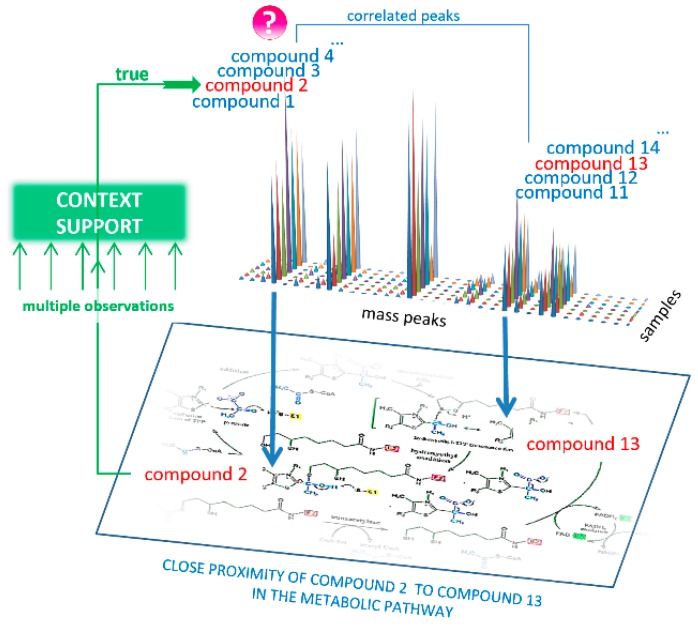
Figure 4.
Concept of the annotation of compounds from mass spectra using biological context data. The mass peak (marked by ‘?’), the intensity of which reflects a concentration of the compound in the sample, is associated with a set of possible compound names (labeled as compounds 1–4), whose molecular weights matched this peak. The essence of the annotation algorithm lies in the fact that the concentrations of compounds in the samples from living organisms are interrelated by metabolic pathways. Therefore, the correct compound name (labeled as compound 2) should be supported by a list of possible compound names (labeled as compounds 11–14) that match the correlated mass peaks because among these names, the names of the compound closely located in the pathway should be presented (labeled as compound 13). If numerous correlated mass peaks are used, the locations of the associated compounds in the metabolic pathways provide statistically sound support (labeled as ‘context support’) to annotate the correct compound name (compound 2).

