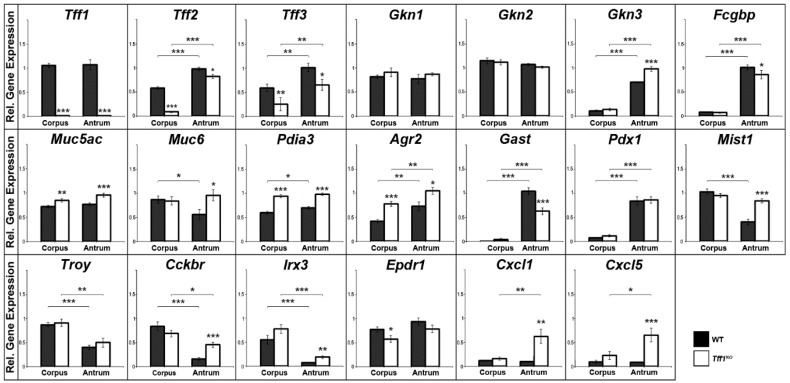
Figure 1.
Semi-quantitative RT-PCR analyses. Tff1 (21x), Tff2 (20x), Tff3 (30x), Gkn1 (21x), Gkn2 (22x), Gkn3 (24x), Fcgbp (31x), Muc5ac (25x), Muc6 (27x), Pdia3 (25x), Agr2 (24x), Gast (26x), Pdx1 (33x), Mist1 (35x), Troy (35x), Cckbr (33x), Irx3 (35x), Epdr1 (33x), Cxcl1 (32x), and Cxcl5 (32x) expression was monitored in the corpus and antrum of 10 male wild-type (WT) and 10 male Tff1KO mice. The relative gene expression levels were normalized against β-actin (Actb, 24x). The number of amplification cycles is given in parentheses. Significances are indicated by asterisks (*, p ≤ 0.05; **, p ≤ 0.01; ***, p ≤ 0.001). WT animals: black bars; Tff1KO animals: white bars.

