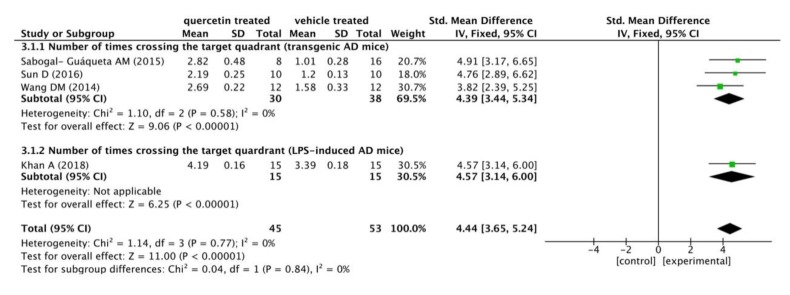
Figure 2.
Forest plot for MWM test analysis: quercetin versus vehicle control. The mean difference and standard error of the number of times crossing the target quadrant in the MWM test of each study was quantificationally measured by ImageJ. The data were meta-analyzed in the form of a forest plot by RevMan 5.3. Based on their different animal models, the four studies were divided into two subgroups.

