Figure 1.
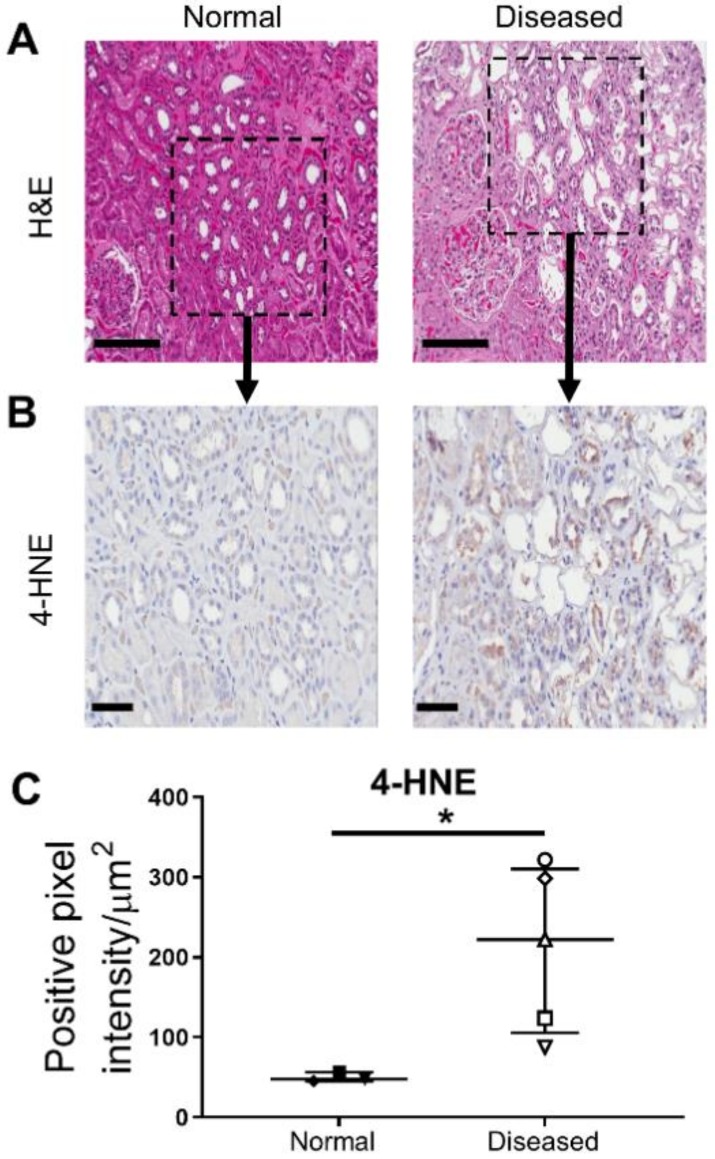
Significantly increased levels of oxidative stress in histologically ‘diseased’ cortical tissue. (A) Hematoxylin (purple) and eosin (pink) (H&E) staining of tissue sections from histologically ‘normal’ (left panel) and ‘diseased’ cortical tissue (right panel) under light microscopy. Representative images from one of five ‘normal’ tissue samples and one of five ‘diseased’ tissue samples. Scale bars represent 200 µm. (B) IHC labelling of histologically ‘normal’ (left panel) and ‘diseased’ cortical tissue (right panel) probed for 4-hydroxynonenal (4-HNE). IHC staining images from representative areas indicated by the black squares in Figure 1A are presented. Scale bars represent 60 µm. (C) Quantitative analysis (positive pixel intensity/µm2 area) of 4-HNE staining in histologically ‘normal’ and ‘diseased’ cortical tissue. Symbols represent individual donor PTEC; n = 3 ‘normal’ and n = 5 ‘diseased’ tissue samples. Horizontal bars represent medians, with interquartile range also presented. * p < 0.05, Mann–Whitney test.

